Localized HAR based on Wi-Fi CSI
Presents the preliminary results on localized HAR using Wi-Fi CSI.
Inertial-based HAR with smartphones and smartwatches has proven its feasibility for real-life applications and state-of-the-art performance. Over the last years, another stream of research has emerged to free users from carrying any type of device: the Wi-Fi CSI (Channel State Information). The key point of the Wi-Fi CSI-based systems is that they employ a Wi-Fi infrastructure enabling device-free sensing (i.e., users do not have to wear any device). In addition, the CSI can be used for diverse tasks, such as HAR and indoor positioning, which would be a major challenge using inertial-based sensors. In this chapter, we analyse the feasibility of a Wi-Fi CSI-based HAR and positioning system using a consumer router and an ESP32 microcontroller, evaluating it by simulating real-life conditions. Preliminary results show a clear instability of the CSI data, thus being unfeasible for real-life applications with the employed devices.
This page contains Plotly interactive figures. Sometimes, the figures might not load properly and show a blank image. Reloading the page might solve the loading issue.
The contents on this section correspond with the Chapter 5 of the dissertation document and constitute an extension of the work “Temporal Stability on Human Activity Recognition based on Wi-Fi CSI” (Matey-Sanz, Torres-Sospedra, and Moreira 2023) presented in the \(13^{th}\) International Conference on Indoor Positioning and Indoor Navigation (IPIN).
A dataset is collected using a TP-Link Archer C80 router (one TX antenna) and a SparkFun Thing Plus ESP32-S2 WROOM (one RX antenna) connected to a laptop. The TX and RX were separated by \(5\) meter in Line of Sight (LOS) condition, with two chairs placed in between them, at \(0.5\) meter from each device. Although the chair partially blocks the signal, we consider the setup to be in LOS condition since no heavy obstacles (e.g., walls) are blocking the signal.
The TX device was configured to work with the standard IEEE 802.11n operating in the channel \(6\). The RX device was configured to establish a connection with the TX, send ping requests at \(100\)Hz, and extract the Wi-Fi CSI information from the HT-LTF subcarriers (\(64\), \(56\) non-null) of the ping responses.
Figure 1 depicts the data collection process. It consisted of one subject moving from one chair to the other repeatedly, collecting data for the activities widely used along this thesis: SEATED, STANDING_UP, WALKING, TURNING and SITTING_DOWN|. Since the subject performed the activities in both directions (i.e., from TX to RX and vice versa), the activities were labelled accordingly (e.g., SEATED_TX/RX, WALKING_TX/RX, etc.) adding a localization component to them.
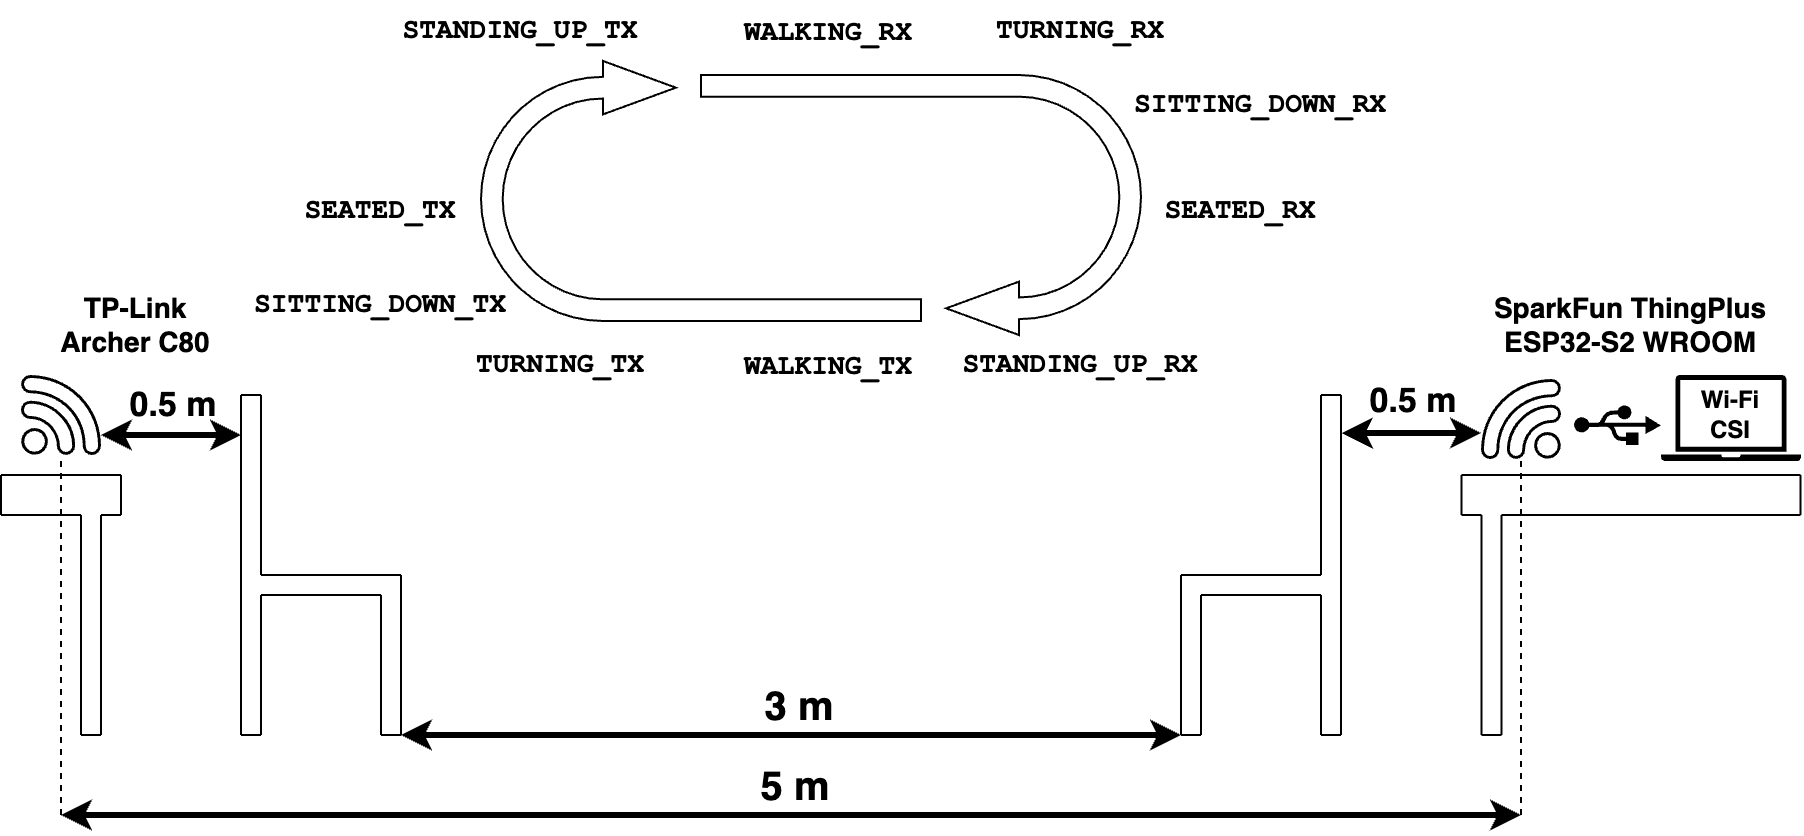
Figure 2 depicts the data collection strategy, which was spaced out over time to explore potential degradation of CSI data over time. The following datasets were collected:
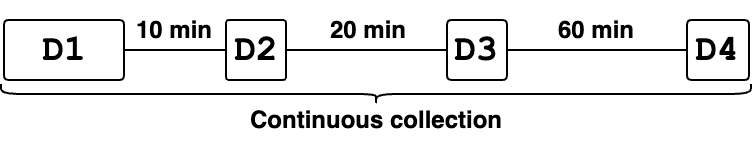
D1: The subject performed the sequence of activities \(20\) times (\(10\) in each direction).D2: After \(10\) minutes of collecting D1, the subject performed again the sequence of activities \(4\) times (\(2\) in each direction).D3: After \(20\) minutes of collecting D2, the subject performed again the sequence of activities \(4\) times.D4: After \(60\) minutes of collecting D3, the subject performed again the sequence of activities \(4\) times.Table 1 shows the number of CSI samples collected for each activity and dataset.
First, from the raw CSI data, the signal amplitude values of each subcarrier where obtained using the equation \[ amplitude_{i} = \sqrt{real_{i}^2 + imaginary_{i}^2}, \] where \(real_{i}\) and \(imaginary_{i}\) are the corresponding components of the complex number associated with the \(i^{th}\) subcarrier. The phase of the signal was discarded.
Next, the dataset was arranged in windows of \(50\) samples with a \(50\%\) overlap. Then, each window was processed using the following techniques:
Figure 3 and Figure 4 depict the raw (after amplitude extraction) and processed CSI data of the first two sequences of D1.
The script employed to execute this process is 01_1_preliminar-dataset-processing.py with the flag --method proposed.
"""Data preprocessing script for preliminar dataset.

Processes the raw data by: arange samples in windows and process them using 1) DBSCAN for outlier detection
and 2-level DWT for threshold based filtering or 2) Choi et al. method.

**Example**:

    $ python 01_1_preliminar-dataset-processing.py
        --input_data_path <PATH_OF_RAW_DATA>
        --windowed_data_path <PATH_TO_STORE_RESULTS>
        --method <PROCESSING_METHOD>
        --window_size <WINDOW_SIZE>
        --window_overlap <WINDOW_OVERLAP>
"""


import argparse
import os
import sys

sys.path.append("../../..")

import numpy as np

from alive_progress import alive_bar
from libs.chapter5.pipeline.processing import proposed_method, choi_method
from libs.chapter5.pipeline.raw_data_loading import load_labelled_data

WINDOW_SIZE = 50
WINDOW_OVERLAP = 25


def create_windows(executions_amplitudes, executions_labels, window_size, window_overlap):
    win = {}
    win_labels = {}
    for execution_id in executions_amplitudes:
        amplitudes = executions_amplitudes[execution_id]
        exec_labels = executions_labels[execution_id]

        data = amplitudes
        n = data.shape[1] // window_overlap

        windows = []
        windows_labels = []
        for i in range(0, (n-1) * window_overlap, window_overlap):
            if i+window_size > data.shape[1]:
                break
            window_labels = exec_labels[i:i+window_size]
            values, counts = np.unique(window_labels, return_counts=True)
            if len(values) != 1:
                continue
            windows.append(data[:,i:i+window_size])
            windows_labels.append(values[counts.argmax()])

        windows = np.array(windows)
        windows_labels = np.array(windows_labels)

        win[execution_id] = windows
        win_labels[execution_id] = windows_labels
    return win, win_labels


def process_windows(executions_windows, processing_function):
    processed_windows = {}
    executions_ids = executions_windows.keys()
    with alive_bar(len(executions_ids), title=f'Processing windows', force_tty=True) as progress_bar:
        for execution_id in executions_ids:
            proc_windows = []
            windows = executions_windows[execution_id]
            for window in windows:
                proc_windows.append(processing_function(window))
            processed_windows[execution_id] = np.array(proc_windows)
            progress_bar()
    return processed_windows


def save_windowed_data(data, labels, directory):
    if not os.path.exists(directory):
        os.makedirs(directory)

    x_file_path = os.path.join(directory, '{0}-x.npy')
    y_file_path = os.path.join(directory, '{0}-y.npy')

    for execution_id in data:
        x = data[execution_id]
        y = labels[execution_id]

        np.save(x_file_path.format(execution_id), x)
        np.save(y_file_path.format(execution_id), y)


if __name__ == '__main__':
    parser = argparse.ArgumentParser()
    parser.add_argument('--input_data_path', help='Path of input data', type=str, required=True)
    parser.add_argument('--windowed_data_path', help='Path to store windowed data', type=str, required=True)
    parser.add_argument('--method', help='Processing method', required=True, choices=['proposed', 'choi'])
    args = parser.parse_args()

    processing_function = proposed_method if args.method == 'proposed' else choi_method

    for dataset in ['D1', 'D2', 'D3', 'D4']:
        print(f'Processing dataset {dataset}')
        executions_amp, labels = load_labelled_data(os.path.join(args.input_data_path, dataset))
        windows, windows_labels = create_windows(executions_amp, labels, WINDOW_SIZE, WINDOW_OVERLAP)
        windows_processed = process_windows(windows, processing_function)
save_windowed_data(windows_processed, windows_labels, os.path.join(args.windowed_data_path, dataset))Since a previous section showed that the CNN was the best-performing model from the selected ones, in this chapter we keep using a CNN architecture despite the domain of the input data being different. The Grid search technique was used to determine the best hyperparameters for the selected architecture. The process was configured to train and evaluate each combination five times using the Adam optimizer during \(50\) epochs with a batch size of \(32\) windows. The process was executed in two phases to reduce the computational cost: 1) optimization of layers and learning hyperparameters, and 2) optimization of the number of layers. Table 2 contains the best combination of hyperparameters
The script employed to execute the Grid Search is 02_hyperparameter-optimization.py with the flag --model cnn.
"""Hyperparameters Grid Search script.

Performs an hyperparameter Grid Search on the specified model. The selected hyperparameters for the search
can be found in `tuning_configuration.py`.

**Example**:

    $ python 02_hyperparameter-optimization.py
        --data_dir <PATH_OF_DATA>
        --model <MLP,CNN>
        --phase <initial,extra-layers>
        --batch_size <BATCH_SIZE>
        --epochs <EPOCHS>
        --executions <EXECUTIONS>
"""


import argparse
import os

import sys
sys.path.append("../../..")

from libs.chapter5.pipeline.data_loading import load_data
from libs.chapter5.pipeline.data_grouping import combine_windows
from libs.chapter5.pipeline.hyperparameters_tuning import get_model_builder, create_tuner, tune, get_tuning_summary
from libs.chapter5.pipeline.tuning_configuration import get_tuning_configuration
from libs.common.data_loading import ground_truth_to_categorical
from libs.common.utils import save_json, set_seed

TUNING_DIR = 'GRID_SEARCH_{0}'
TUNING_SUMMARY_FILE = 'summary.json'

BATCH_SIZE = 32
EPOCHS = 50
N_EXECUTIONS = 5

MAPPING = {
    'SEATED_RX': 0,
    'STANDING_UP_RX': 1,
    'WALKING_TX': 2,
    'TURN_TX': 3,
    'SITTING_DOWN_TX': 4,
    'SEATED_TX': 5,
    'STANDING_UP_TX': 6,
    'WALKING_RX': 7,
    'TURN_RX': 8,
    'SITTING_DOWN_RX': 9,
}

def tune_model(data, model_type, batch_size, epochs, n_executions, phase):
    set_seed()
    model_builder = get_model_builder(model_type)
    optimizing_layers = phase == 'extra-layers'

    for source, (x, y) in data.items():
        features_dimension = x.shape[1]
        tuning_configuration = get_tuning_configuration(model_type, source if optimizing_layers else None)
        tuning_configuration['features_dimension'] = features_dimension
        tuning_project = f'{model_type}_{source}{"_layers" if optimizing_layers else ""}'
        print(f'Tuning {model_type} model with {source} data')
        tuner = create_tuner(
            model_builder,
            n_executions,
            tuning_configuration,
            TUNING_DIR.format(phase),
            tuning_project
        )

        tuner = tune(tuner, x, y, epochs, batch_size)
        save_tuning_summary(tuner, os.path.join(TUNING_DIR, tuning_project))


def save_tuning_summary(tuner, tuning_dir):
    save_json(get_tuning_summary(tuner), tuning_dir, TUNING_SUMMARY_FILE)


if __name__ == '__main__':
    parser = argparse.ArgumentParser()
    parser.add_argument('--data_dir', help='data directory', type=str, required=True)
    parser.add_argument('--model', help='optimize hyperparameters for selected model', type=str, choices=['mlp', 'cnn'])
    parser.add_argument('--phase', help='tuning phase: <initial> to tune layer hyperparameters and <extra-layers> to tune number of layers' , type=str, choices=['initial', 'extra-layers'])
    parser.add_argument('--batch_size', help='training batch size', type=int, default=BATCH_SIZE)
    parser.add_argument('--epochs', help='training epochs', type=int, default=EPOCHS)
    parser.add_argument('--executions', help='executions per trial', type=int, default=N_EXECUTIONS)
    args = parser.parse_args()

    d1_windows, d1_labels = load_data(args.data_dir)
    y = ground_truth_to_categorical(d1_labels, MAPPING)
    x, y = combine_windows(d1_windows, y)
    print(x.shape)

    data = {
        'csi': (x, y)
    }
tune_model(data, args.model, args.batch_size, args.epochs, args.executions, args.phase) Figure 5 depicts the three different evaluation approaches employed to determine the performance of a Wi-Fi CSI model for localized HAR and study the stability of the CSI data over time.
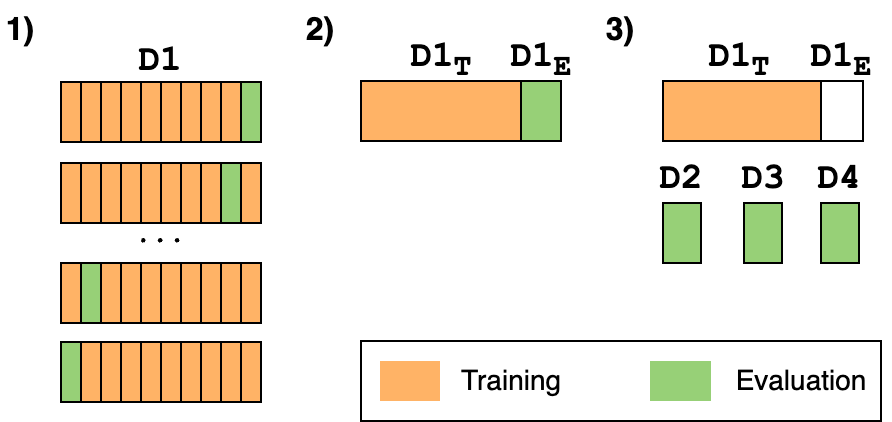
D1. Then, D1 is split in D1T and D1E (\(80\%/20\%\)) maintaining temporal dependencies. Finally, datasets D2, D3 and D4 evaluate a model trained with D1T.
D1 dataset and \(K=10\).D1 are used for training and the remaining (last) \(4\) sequences (\(20\%\)) for evaluation. These subsets of D1 are named D1T (training) and D1E (evaluation). This is a basic approach to investigate the stability of the data.D1T is evaluated using the data from D2, D3 and D4. This approach allows to analyse the variation of the classification performance in different time frames (\(10\), \(30\) and \(90\) minutes after D1) and therefore, to determine the stability of the CSI data.The script employed to execute this process is 03_1_multiple-evaluations.py with the flag --model cnn.
"""Multiple evaluation script

Performs a cross-validation and an evaluation with different subsets collected at different time frames.

**Example**:

    $ python 03_1_multiple_evaluations.py
        --data_dir <PATH_OF_DATA>
        --reports_dir <PATH_TO_STORE_REPORTS>
        --model <MLP,CNN>
"""


import argparse
import os
import sys
sys.path.append("../../..")


from tensorflow import keras
from tensorflow.keras import layers

from libs.chapter5.pipeline.data_loading import load_data
from libs.chapter5.pipeline.data_grouping import combine_windows, split_train_test
from libs.chapter5.pipeline.ml import cross_validation, evaluate_model
from libs.common.data_loading import ground_truth_to_categorical
from libs.common.utils import save_json, set_seed

MAPPING = {
    'SEATED_RX': 0,
    'STANDING_UP_RX': 1,
    'WALKING_TX': 2,
    'TURN_TX': 3,
    'SITTING_DOWN_TX': 4,
    'SEATED_TX': 5,
    'STANDING_UP_TX': 6,
    'WALKING_RX': 7,
    'TURN_RX': 8,
    'SITTING_DOWN_RX': 9,
}
LABELS = ['SEATED_RX','STANDING_UP_RX','WALKING_TX','TURNING_TX','SITTING_DOWN_TX', 'SEATED_TX', 'STANDING_UP_TX','WALKING_RX','TURNING_RX','SITTING_DOWN_RX']
NUM_CLASSES = len(LABELS)

TRAIN_IDS = ['e01_rx_tx', 'e01_tx_rx', 'e02_rx_tx', 'e02_tx_rx', 'e03_rx_tx', 'e03_tx_rx', 'e04_rx_tx', 'e04_tx_rx',
             'e05_rx_tx', 'e05_tx_rx', 'e06_rx_tx', 'e06_tx_rx', 'e07_rx_tx', 'e07_tx_rx', 'e08_rx_tx', 'e08_tx_rx']
TEST_IDS = ['e09_rx_tx', 'e09_tx_rx', 'e10_rx_tx', 'e10_tx_rx']

BATCH_SIZE = 32
EPOCHS = 50
FOLDS = 10

def mlp_model():
    set_seed()

    model = keras.Sequential([
        layers.Dense(128, activation='relu', input_shape=(500,)),
        layers.Dense(1024, activation='relu'),
        layers.Dense(1024, activation='relu'),
        layers.Dense(1024, activation='relu'),
        layers.Dense(NUM_CLASSES, activation='softmax')
    ])

    model.compile(loss='categorical_crossentropy', optimizer=keras.optimizers.Adam(learning_rate=0.0005), metrics=['accuracy'])
    return model


def cnn_model():
    set_seed()

    model = keras.Sequential([
        layers.Conv2D(filters=128, kernel_size=(5,25), input_shape=(56, 50, 1)),
        layers.BatchNormalization(),
        layers.Activation('relu'),
        layers.MaxPooling2D(),

        layers.Flatten(),

        layers.Dense(512, activation='relu'),
        layers.Dense(NUM_CLASSES, activation='softmax')
    ])

    model.compile(loss='categorical_crossentropy', optimizer=keras.optimizers.Adam(learning_rate=0.0001), metrics=['accuracy'])
    return model


def model_builder(model_type):
    if model_type == 'cnn':
        return cnn_model
    return mlp_model


if __name__ == '__main__':
    parser = argparse.ArgumentParser()
    parser.add_argument('--data_dir', help='data directory', type=str, required=True)
    parser.add_argument('--reports_dir', help='directory to store the generated classification reports', type=str, required=True)
    parser.add_argument('--model', help='optimize hyperparameters for selected model', type=str, choices=['mlp', 'cnn'])
    args = parser.parse_args()

    d1_windows, d1_labels = load_data(os.path.join(args.data_dir, 'D1'))
    d1_labels_cat = ground_truth_to_categorical(d1_labels, MAPPING)
    x, y = combine_windows(d1_windows, d1_labels_cat)

    print("Starting 10-fold cross-validation")
    cv_reports = cross_validation(x, y, model_builder(args.model), FOLDS, BATCH_SIZE, EPOCHS, LABELS)
    save_json(cv_reports, args.reports_dir, 'cv_report.json')

    print("Starting D1T training and D1E evaluation")
    (x_d1t, y_d1t), (x_d1e, y_d1e) = split_train_test(d1_windows, d1_labels_cat, TRAIN_IDS, TEST_IDS)
    model = model_builder(args.model)()
    model.fit(x_d1t, y_d1t, batch_size=BATCH_SIZE, epochs=EPOCHS, verbose=0)
    report = evaluate_model(model, x_d1e, y_d1e, LABELS)
    save_json(report, args.reports_dir, 'd1_report.json')

    print("Starting D2, D3 and D4 evaluation")
    for eval_dataset in ['D2', 'D3', 'D4']:
        windows, labels = load_data(os.path.join(args.data_dir, eval_dataset))
        labels_cat = ground_truth_to_categorical(labels, MAPPING)
        x, y = combine_windows(windows, labels_cat)
        report = evaluate_model(model, x, y, LABELS)
        save_json(report, args.reports_dir, f'{eval_dataset.lower()}_report.json')
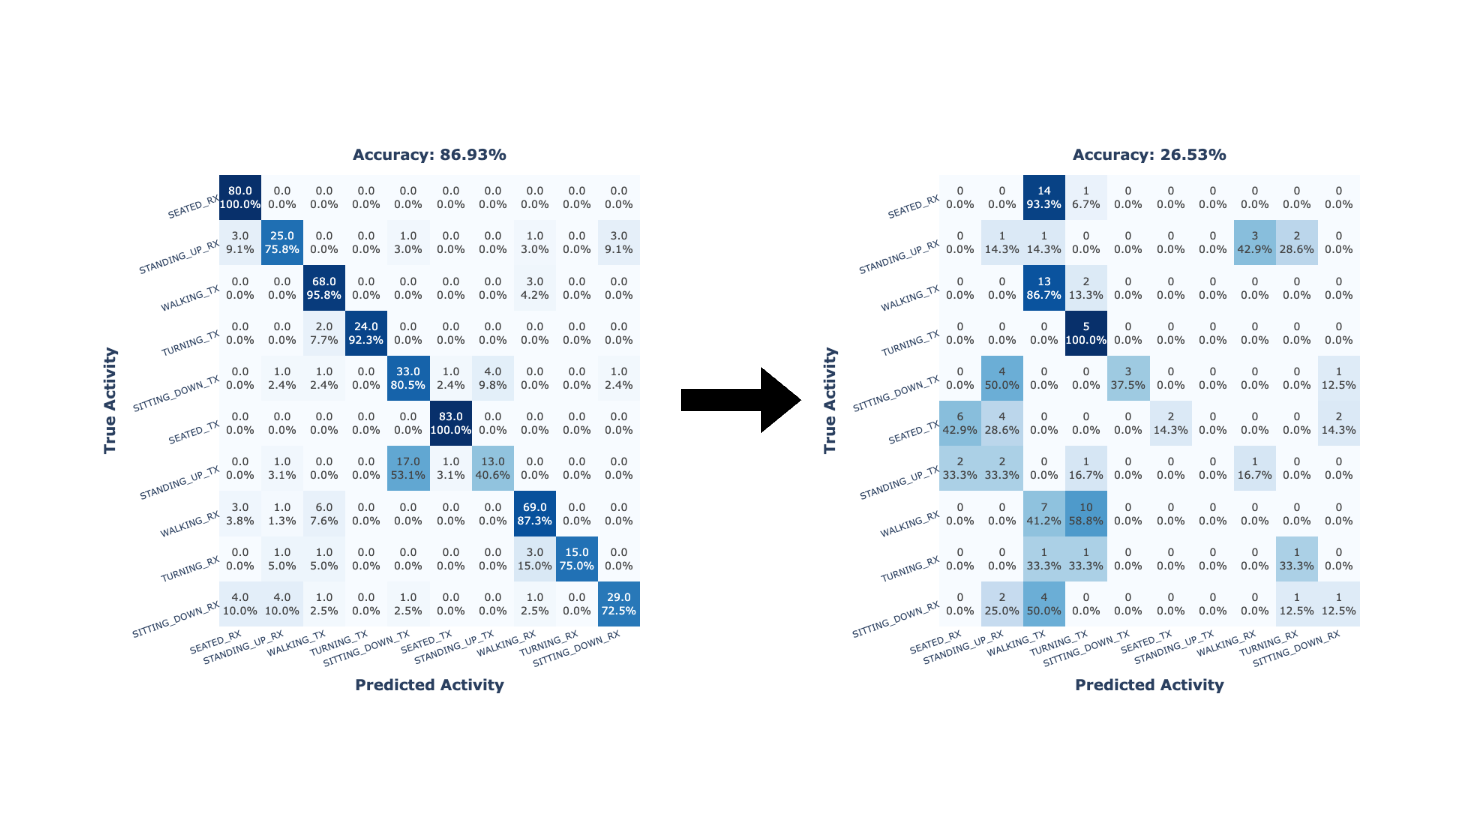
The previous methodology resulted in non-satisfactory outcomes (see Localized HAR based on Wi-Fi CSI). The results showed a clear degradation in the classification accuracy of the employed CNN model when the evaluation took into account data collected spaced in time regarding the training data. That is, classification accuracy quickly degrades over time.
Notwithstanding, temporal instability of CSI data is only one possible explanation for the poor obtained results. Concretely, the following factors could affect the results:
Next, we aim to determine the cause of the bad results presented in Localized HAR based on Wi-Fi CSI. First, to determine that our method is appropriate for CSI data (1), we applied it to two public datasets and compared the results with other state-of-the-art works (Validation of employed methods). Then, to prove that alternative methods validated in the literature would have obtained similar results to our method (1), we applied the method from a related work on our collected dataset (Validation of employed methods). Finally, to verify the temporal stability of the CSI data (4), a new dataset was collected over several days to evaluate the similarity of the data across days (Temporal stability of Wi-Fi CSI data from ESP32 microcontrollers). The remaining factors could not be explored due to resource limitations (2) and the impossibility of determining the existence of external interferences while collecting the dataset (3).
Two publicly available datasets have been used to validate the methods and model employed: the StanWiFi and the Multi-environment dataset.
E1 and E2 in LOS conditions and E3 in NLOS condition (Alsaify et al. 2020). The latter dataset is discarded since we focus on LOS conditions. The datasets were collected using two computers (Tx and Rx) equipped with an Intel 5300 NIC, which were separated by \(3.7\) meter sin E1 and \(7.6\) meters in E2. The CSI data was collected from \(90\) subcarriers at \(320\)Hz corresponding to \(12\) different activities classified in \(6\) groups: no movement, falling, walking, sitting/standing, turning and pick up.The data preparation steps described in Data preparation were applied to both datasets. While for the collected dataset the windows consisted of \(0.5\) seconds of data, a window size of \(1\) seconds was employed in both public datasets since they contain a higher amount of data.
The script employed to execute the process in StanWiFi dataset is 01_2_stanwifi-processing.py.
"""Data preprocessing script for StanWiFi dataset.

Processes the raw data by processing the windows generated by the author's scripts using DBSCAN for outlier detection
and 2-level DWT for threshold based filtering.

**Example**:

    $ python 01_2_stanwifi-processing.py
        --input_data_path <PATH_OF_RAW_DATA>
        --windowed_data_path <PATH_TO_STORE_RESULTS>
"""

import argparse
import os
import sys

sys.path.append("../../..")

import numpy as np

from cross_vali_input_data import csv_import
from libs.chapter5.pipeline.processing import proposed_method


if __name__ == '__main__':
    parser = argparse.ArgumentParser()
    parser.add_argument('--windowed_data_path', help='Path to store windowed data', type=str, required=True)
    args = parser.parse_args()

    x_bed, x_fall, x_pickup, x_run, x_sitdown, x_standup, x_walk, \
    y_bed, y_fall, y_pickup, y_run, y_sitdown, y_standup, y_walk = csv_import()

    x_subsets = [x_bed, x_fall, x_run, x_sitdown, x_standup, x_walk]
    y_subsets = [y_bed, y_fall, y_run, y_sitdown, y_standup, y_walk]

    x_proc = []
    y_proc = []
    for x, y in zip(x_subsets, y_subsets):
        x_proc.append(proposed_method(x))
        y_proc.append(np.delete(y, [0,4], axis=1))

    x = np.vstack(x_proc)
    x = np.transpose(x, axes=(0,2,1))
    y = np.vstack(y_proc)

    np.save(os.path.join(args.windowed_data_path, 'x.npy'), x)
    np.save(os.path.join(args.windowed_data_path, 'y.npy'), y)
The script employed to execute the process in Multi-environment dataset is 01_3_multienvironment-processing.py.
"""Data preprocessing script for Multi-environment dataset.

Processes the raw data by aranging samples in windows and processing them using DBSCAN for outlier detection
and 2-level DWT for threshold based filtering

**Example**:

    $ python 01_3_multienvironment-processing.py
        --input_data_path <PATH_OF_RAW_DATA>
        --windowed_data_path <PATH_TO_STORE_RESULTS>
"""

import argparse
import copy
import os
import sys
sys.path.append("../../..")

import numpy as np
import pandas as pd

from alive_progress import alive_bar
from libs.chapter5.pipeline.processing import proposed_method
from math import sqrt

ACTIVITY_MAPPING = {
    'A01': 'A1',
    'A02': 'A2',
    'A03': 'A1',
    'A04': 'A1',
    'A05': 'A2',
    'A06': 'A3',
    'A07': 'A5',
    'A08': 'A3',
    'A09': 'A5',
    'A10': 'A4',
    'A11': 'A4',
    'A12': 'A6',
}

def load_multienvironment_dataset(environment):
    data = {}
    subject_dirs = os.listdir(environment)
    subject_dirs = list(filter(lambda x: x.startswith('Subject'), subject_dirs))
    with alive_bar(len(subject_dirs), title=f'Loading data from subjects', force_tty=True) as progress_bar:
        for subject_dir in subject_dirs:
            subject = f'S{int(subject_dir.split(" ")[-1]):02d}'
            data[subject] = {}
            subject_dir_path = os.path.join(environment, subject_dir)
            for file in os.listdir(subject_dir_path):
                if not file.endswith('.csv'):
                    continue

                base_activity = file.split('_')[3]
                file_path = os.path.join(subject_dir_path, file)
                df = pd.read_csv(file_path)
                df = df.iloc[160:-160] #remove 0.5 sec after and before due to noise

                if base_activity not in data[subject]:
                    data[subject][base_activity] = df
                else:
                    data[subject][base_activity] = pd.concat([data[subject][base_activity], df])
            progress_bar()
    return data


def amplitude_from_raw_data(data):
    amplitudes = {}
    with alive_bar(len(data.keys()), title=f'Extracting amplitudes from subject\'s data', force_tty=True) as progress_bar:
        for subject in data:
            amplitudes[subject] = {}
            for activity in data[subject]:
                activity_data = data[subject][activity]
                activity_amplitudes = []
                for index, row in activity_data.iterrows():
                    instance_amplitudes = []
                    for antenna in range(1,4):
                        for subcarrier in range(1,31):
                            csi_data = row[f'csi_1_{antenna}_{subcarrier}']
                            real, imaginary = csi_data.split('+')
                            real = int(real)
                            imaginary = int(imaginary[:-1])

                            instance_amplitudes.append(sqrt(imaginary ** 2 + real ** 2))
                    activity_amplitudes.append(instance_amplitudes)
                amplitudes[subject][activity] = np.array(activity_amplitudes)
            progress_bar()
    return amplitudes


def create_windows(amplitudes, window_size=320, window_overlap=160):
    windows = {}
    windows_labels = {}
    for subject_id in amplitudes:
        subject_windows = []
        subject_windows_labels = []
        for activity_id in amplitudes[subject_id]:
            activity_amplitudes = amplitudes[subject_id][activity_id].T

            n = activity_amplitudes.shape[1] // window_overlap
            for i in range(0, (n-1) * window_overlap, window_overlap):
                if i+window_size > activity_amplitudes.shape[1]:
                    break
                subject_windows.append(activity_amplitudes[:,i:i+window_size])
                subject_windows_labels.append(ACTIVITY_MAPPING[activity_id])

        windows[subject_id] = np.array(subject_windows)
        windows_labels[subject_id] = np.array(subject_windows_labels)
    return windows, windows_labels


def process_windows(windows):
    proc_windows = {}
    with alive_bar(len(windows.keys()), title=f'Processing subject\'s windows', force_tty=True) as progress_bar:
        for subject_id in windows:
            windows_copy = copy.deepcopy(windows[subject_id])
            for i in range(len(windows_copy)):
                windows_copy[i] = proposed_method(windows_copy[i])
            proc_windows[subject_id] = windows_copy
            progress_bar()
    return proc_windows


def save_windowed_data(data, labels, directory):
    for subject_id, subject_data in data.items():
        np.save(os.path.join(directory, f'{subject_id}_x.npy'), subject_data)
        np.save(os.path.join(directory, f'{subject_id}_x.npy'), labels[subject_id])


if __name__ == '__main__':
    parser = argparse.ArgumentParser()
    parser.add_argument('--input_data_path', help='Path of input data', type=str, required=True)
    parser.add_argument('--windowed_data_path', help='Path to store windowed data', type=str, required=True)
    args = parser.parse_args()

    for dataset in ['ENVIRONMENT 1', 'ENVIRONMENT 2']:
        print(f'Processing dataset {dataset}')
        data = load_multienvironment_dataset(os.path.join(args.input_data_path, dataset))
        amplitudes = amplitude_from_raw_data(data)
        windows, windows_labels = create_windows(amplitudes)

        del data, amplitudes

        proc_windows = process_windows(windows)
        save_windowed_data(proc_windows, windows_labels, args.windowed_data_path)
As regards the HAR classifier, the model architecture described in HAR classifier was employed, with minor adaptations in some hyperparameters due to computational limitations2. The adaptations in each dataset are the following:
2 The higher dimensionality of both datasets (higher sampling rate and data from more subcarriers) compared with the collected one makes it unfeasible to use the previous model due to memory limitations.
E1 and E2): \(8\) number of filters, \(256\) batch size and \(30\) epochs.Finally, the experimental procedure consisted of the \(10\)-fold cross-validation to evaluate the CNN model in the public datasets. The results are compared with other related works also employing a K-fold cross-validation approach.
The script employed to execute this process in the StanWiFi is 03_2_cross-validation.py with the flag --dataset stanwifi. The same script was used for the Multienvironment dataset employing the flag --dataset multienvironment.
"""Cross-validation script

Performs a cross-validation on the selected dataset.

**Example**:

    $ python 03_2_cross-validation.py
        --data_dir <PATH_OF_DATA>
        --reports_dir <PATH_TO_STORE_REPORTS>
        --dataset <stanwifi,multienvironment>
"""

import argparse
import os
import sys
sys.path.append("../../..")

import numpy as np

from tensorflow import keras
from tensorflow.keras import layers

from libs.chapter5.pipeline.data_grouping import combine_windows
from libs.chapter5.pipeline.ml import cross_validation
from libs.common.data_loading import ground_truth_to_categorical
from libs.common.utils import save_json, set_seed

STANWIFI_LABELS = ['LIE DOWN', 'FALL', 'WALK', 'RUN', 'SITDOWN', 'STANDUP']
STANWIFI_BATCH_SIZE = 128

MULTI_ENV_LABELS = ['No movement', 'Falling', 'Walking', 'Sitting/Standing', 'Turning', 'Pick up pen']
MULTI_ENV_MAPPING = {'A1': 0, 'A2': 1, 'A3': 2, 'A4': 3, 'A5': 4, 'A6': 5}
MULTIENV_BATCH_SIZE = 256

FOLDS = 10
EPOCHS = 30


def stanwifi_model():
    set_seed()

    model = keras.Sequential([
        layers.Conv2D(filters=16, kernel_size=(5,25), input_shape=(90, 500, 1)),
        layers.BatchNormalization(),
        layers.Activation('relu'),
        layers.MaxPooling2D(),

        layers.Flatten(),

        layers.Dense(512, activation='relu'),
        layers.Dense(6, activation='softmax')
    ])

    model.compile(loss='categorical_crossentropy', optimizer=keras.optimizers.Adam(learning_rate=0.0001), metrics=['accuracy'])
    return model


def multienvironment_model():
    set_seed()

    model = keras.Sequential([
        layers.Conv2D(filters=8, kernel_size=(5,25), input_shape=(90, 320, 1)),
        layers.BatchNormalization(),
        layers.Activation('relu'),
        layers.MaxPooling2D(),

        layers.Flatten(),

        layers.Dense(512, activation='relu'),
        layers.Dense(6, activation='softmax')
    ])

    model.compile(loss='categorical_crossentropy', optimizer=keras.optimizers.Adam(learning_rate=0.0001), metrics=['accuracy'])
    return model


def load_multienv_data(path, dataset_dir):
    dataset_path = os.path.join(path, dataset_dir)
    subjects = ['S01', 'S02', 'S03', 'S04', 'S05', 'S06', 'S07', 'S08', 'S09', 'S10'] if dataset_dir == 'E1' else ['S11', 'S12', 'S13', 'S14', 'S15', 'S16', 'S17', 'S18', 'S19', 'S20']

    windows = {}
    windows_labels = {}
    for subject_id in subjects:
        windows[subject_id] = np.load(os.path.join(dataset_path, f'x_{subject_id}.npy'))
        windows_labels[subject_id] = np.load(os.path.join(dataset_path, f'y_{subject_id}.npy'))
    return windows, windows_labels


if __name__ == '__main__':
    parser = argparse.ArgumentParser()
    parser.add_argument('--data_dir', help='data directory', type=str, required=True)
    parser.add_argument('--reports_dir', help='directory to store the generated classification reports', type=str, required=True)
    parser.add_argument('--dataset', help='optimize hyperparameters for selected model', type=str, choices=['stanwifi', 'multienvironment'])
    args = parser.parse_args()

    if args.dataset == 'stanwifi':
        x = np.load(os.path.join(args.data_dir, 'x.npy'))
        y = np.load(os.path.join(args.data_dir, 'x.npy'))

        model_builder = stanwifi_model
        batch_size = STANWIFI_BATCH_SIZE
        labels = STANWIFI_LABELS
        reports = cross_validation(x, y, stanwifi_model, FOLDS, STANWIFI_BATCH_SIZE, EPOCHS, STANWIFI_LABELS)
        save_json(reports, args.reports_dir, 'cv_report.json')
    else:
        for dataset in ['E1', 'E2']:
            windows, windows_labels = load_multienv_data(args.data_dir, dataset)
            windows_labels_cat = ground_truth_to_categorical(windows_labels, MULTI_ENV_MAPPING)
            x, y = combine_windows(windows, windows_labels_cat)
            reports = cross_validation(x, y, multienvironment_model, FOLDS, MULTIENV_BATCH_SIZE, EPOCHS, MULTI_ENV_LABELS)
save_json(reports, args.reports_dir, f'{dataset.lower()}-cv_report.json')The methods proposed by Choi et al. (2022) have been applied to the collected dataset. In their work, the authors extract a set of hand-crafted features from the CSI data and employ an MLP model for crowd counting and localization. Choi’s et al. methods have been selected since they followed an appropiate evaluation taking into account the stability of the signal and only showed a small drop in performance.
As in Data preparation, the amplitude is extracted from the CSI data and the dataset is arranged in windows of \(50\) samples with a \(50\%\) overlap. Then, the methods presented by Choi et al. (2022) are applied:
The script employed to execute this process is 01_1_preliminar-dataset-processing.py with the flag --method choi.
"""Data preprocessing script for preliminar dataset.

Processes the raw data by: arange samples in windows and process them using 1) DBSCAN for outlier detection
and 2-level DWT for threshold based filtering or 2) Choi et al. method.

**Example**:

    $ python 01_1_preliminar-dataset-processing.py
        --input_data_path <PATH_OF_RAW_DATA>
        --windowed_data_path <PATH_TO_STORE_RESULTS>
        --method <PROCESSING_METHOD>
        --window_size <WINDOW_SIZE>
        --window_overlap <WINDOW_OVERLAP>
"""


import argparse
import os
import sys

sys.path.append("../../..")

import numpy as np

from alive_progress import alive_bar
from libs.chapter5.pipeline.processing import proposed_method, choi_method
from libs.chapter5.pipeline.raw_data_loading import load_labelled_data

WINDOW_SIZE = 50
WINDOW_OVERLAP = 25


def create_windows(executions_amplitudes, executions_labels, window_size, window_overlap):
    win = {}
    win_labels = {}
    for execution_id in executions_amplitudes:
        amplitudes = executions_amplitudes[execution_id]
        exec_labels = executions_labels[execution_id]

        data = amplitudes
        n = data.shape[1] // window_overlap

        windows = []
        windows_labels = []
        for i in range(0, (n-1) * window_overlap, window_overlap):
            if i+window_size > data.shape[1]:
                break
            window_labels = exec_labels[i:i+window_size]
            values, counts = np.unique(window_labels, return_counts=True)
            if len(values) != 1:
                continue
            windows.append(data[:,i:i+window_size])
            windows_labels.append(values[counts.argmax()])

        windows = np.array(windows)
        windows_labels = np.array(windows_labels)

        win[execution_id] = windows
        win_labels[execution_id] = windows_labels
    return win, win_labels


def process_windows(executions_windows, processing_function):
    processed_windows = {}
    executions_ids = executions_windows.keys()
    with alive_bar(len(executions_ids), title=f'Processing windows', force_tty=True) as progress_bar:
        for execution_id in executions_ids:
            proc_windows = []
            windows = executions_windows[execution_id]
            for window in windows:
                proc_windows.append(processing_function(window))
            processed_windows[execution_id] = np.array(proc_windows)
            progress_bar()
    return processed_windows


def save_windowed_data(data, labels, directory):
    if not os.path.exists(directory):
        os.makedirs(directory)

    x_file_path = os.path.join(directory, '{0}-x.npy')
    y_file_path = os.path.join(directory, '{0}-y.npy')

    for execution_id in data:
        x = data[execution_id]
        y = labels[execution_id]

        np.save(x_file_path.format(execution_id), x)
        np.save(y_file_path.format(execution_id), y)


if __name__ == '__main__':
    parser = argparse.ArgumentParser()
    parser.add_argument('--input_data_path', help='Path of input data', type=str, required=True)
    parser.add_argument('--windowed_data_path', help='Path to store windowed data', type=str, required=True)
    parser.add_argument('--method', help='Processing method', required=True, choices=['proposed', 'choi'])
    args = parser.parse_args()

    processing_function = proposed_method if args.method == 'proposed' else choi_method

    for dataset in ['D1', 'D2', 'D3', 'D4']:
        print(f'Processing dataset {dataset}')
        executions_amp, labels = load_labelled_data(os.path.join(args.input_data_path, dataset))
        windows, windows_labels = create_windows(executions_amp, labels, WINDOW_SIZE, WINDOW_OVERLAP)
        windows_processed = process_windows(windows, processing_function)
        save_windowed_data(windows_processed, windows_labels, os.path.join(args.windowed_data_path, dataset))
As HAR classifier, an MLP model is employed, but instead of using the same architecture as the one employed by Choi, a Grid search process was executed to determine the most appropriate hyperparameters for our dataset.
The Grid search was carried out as described in HAR classifier. Table 3 contains the best combination of hyperparameters.
The script employed to execute the Grid Search is 02_hyperparameter-optimization.py with the flag --model mlp.
"""Hyperparameters Grid Search script.

Performs an hyperparameter Grid Search on the specified model. The selected hyperparameters for the search
can be found in `tuning_configuration.py`.

**Example**:

    $ python 02_hyperparameter-optimization.py
        --data_dir <PATH_OF_DATA>
        --model <MLP,CNN>
        --phase <initial,extra-layers>
        --batch_size <BATCH_SIZE>
        --epochs <EPOCHS>
        --executions <EXECUTIONS>
"""


import argparse
import os

import sys
sys.path.append("../../..")

from libs.chapter5.pipeline.data_loading import load_data
from libs.chapter5.pipeline.data_grouping import combine_windows
from libs.chapter5.pipeline.hyperparameters_tuning import get_model_builder, create_tuner, tune, get_tuning_summary
from libs.chapter5.pipeline.tuning_configuration import get_tuning_configuration
from libs.common.data_loading import ground_truth_to_categorical
from libs.common.utils import save_json, set_seed

TUNING_DIR = 'GRID_SEARCH_{0}'
TUNING_SUMMARY_FILE = 'summary.json'

BATCH_SIZE = 32
EPOCHS = 50
N_EXECUTIONS = 5

MAPPING = {
    'SEATED_RX': 0,
    'STANDING_UP_RX': 1,
    'WALKING_TX': 2,
    'TURN_TX': 3,
    'SITTING_DOWN_TX': 4,
    'SEATED_TX': 5,
    'STANDING_UP_TX': 6,
    'WALKING_RX': 7,
    'TURN_RX': 8,
    'SITTING_DOWN_RX': 9,
}

def tune_model(data, model_type, batch_size, epochs, n_executions, phase):
    set_seed()
    model_builder = get_model_builder(model_type)
    optimizing_layers = phase == 'extra-layers'

    for source, (x, y) in data.items():
        features_dimension = x.shape[1]
        tuning_configuration = get_tuning_configuration(model_type, source if optimizing_layers else None)
        tuning_configuration['features_dimension'] = features_dimension
        tuning_project = f'{model_type}_{source}{"_layers" if optimizing_layers else ""}'
        print(f'Tuning {model_type} model with {source} data')
        tuner = create_tuner(
            model_builder,
            n_executions,
            tuning_configuration,
            TUNING_DIR.format(phase),
            tuning_project
        )

        tuner = tune(tuner, x, y, epochs, batch_size)
        save_tuning_summary(tuner, os.path.join(TUNING_DIR, tuning_project))


def save_tuning_summary(tuner, tuning_dir):
    save_json(get_tuning_summary(tuner), tuning_dir, TUNING_SUMMARY_FILE)


if __name__ == '__main__':
    parser = argparse.ArgumentParser()
    parser.add_argument('--data_dir', help='data directory', type=str, required=True)
    parser.add_argument('--model', help='optimize hyperparameters for selected model', type=str, choices=['mlp', 'cnn'])
    parser.add_argument('--phase', help='tuning phase: <initial> to tune layer hyperparameters and <extra-layers> to tune number of layers' , type=str, choices=['initial', 'extra-layers'])
    parser.add_argument('--batch_size', help='training batch size', type=int, default=BATCH_SIZE)
    parser.add_argument('--epochs', help='training epochs', type=int, default=EPOCHS)
    parser.add_argument('--executions', help='executions per trial', type=int, default=N_EXECUTIONS)
    args = parser.parse_args()

    d1_windows, d1_labels = load_data(args.data_dir)
    y = ground_truth_to_categorical(d1_labels, MAPPING)
    x, y = combine_windows(d1_windows, y)
    print(x.shape)

    data = {
        'csi': (x, y)
    }
    tune_model(data, args.model, args.batch_size, args.epochs, args.executions, args.phase)
The same experimental procedure described in Experimental procedure with the three evaluation approaches is employed using the method presented by Choi in our collected dataset.
The script employed to execute this process is 03_1_multiple-evaluations.py with the flag --model mlp.
"""Multiple evaluation script

Performs a cross-validation and an evaluation with different subsets collected at different time frames.

**Example**:

    $ python 03_1_multiple_evaluations.py
        --data_dir <PATH_OF_DATA>
        --reports_dir <PATH_TO_STORE_REPORTS>
        --model <MLP,CNN>
"""


import argparse
import os
import sys
sys.path.append("../../..")


from tensorflow import keras
from tensorflow.keras import layers

from libs.chapter5.pipeline.data_loading import load_data
from libs.chapter5.pipeline.data_grouping import combine_windows, split_train_test
from libs.chapter5.pipeline.ml import cross_validation, evaluate_model
from libs.common.data_loading import ground_truth_to_categorical
from libs.common.utils import save_json, set_seed

MAPPING = {
    'SEATED_RX': 0,
    'STANDING_UP_RX': 1,
    'WALKING_TX': 2,
    'TURN_TX': 3,
    'SITTING_DOWN_TX': 4,
    'SEATED_TX': 5,
    'STANDING_UP_TX': 6,
    'WALKING_RX': 7,
    'TURN_RX': 8,
    'SITTING_DOWN_RX': 9,
}
LABELS = ['SEATED_RX','STANDING_UP_RX','WALKING_TX','TURNING_TX','SITTING_DOWN_TX', 'SEATED_TX', 'STANDING_UP_TX','WALKING_RX','TURNING_RX','SITTING_DOWN_RX']
NUM_CLASSES = len(LABELS)

TRAIN_IDS = ['e01_rx_tx', 'e01_tx_rx', 'e02_rx_tx', 'e02_tx_rx', 'e03_rx_tx', 'e03_tx_rx', 'e04_rx_tx', 'e04_tx_rx',
             'e05_rx_tx', 'e05_tx_rx', 'e06_rx_tx', 'e06_tx_rx', 'e07_rx_tx', 'e07_tx_rx', 'e08_rx_tx', 'e08_tx_rx']
TEST_IDS = ['e09_rx_tx', 'e09_tx_rx', 'e10_rx_tx', 'e10_tx_rx']

BATCH_SIZE = 32
EPOCHS = 50
FOLDS = 10

def mlp_model():
    set_seed()

    model = keras.Sequential([
        layers.Dense(128, activation='relu', input_shape=(500,)),
        layers.Dense(1024, activation='relu'),
        layers.Dense(1024, activation='relu'),
        layers.Dense(1024, activation='relu'),
        layers.Dense(NUM_CLASSES, activation='softmax')
    ])

    model.compile(loss='categorical_crossentropy', optimizer=keras.optimizers.Adam(learning_rate=0.0005), metrics=['accuracy'])
    return model


def cnn_model():
    set_seed()

    model = keras.Sequential([
        layers.Conv2D(filters=128, kernel_size=(5,25), input_shape=(56, 50, 1)),
        layers.BatchNormalization(),
        layers.Activation('relu'),
        layers.MaxPooling2D(),

        layers.Flatten(),

        layers.Dense(512, activation='relu'),
        layers.Dense(NUM_CLASSES, activation='softmax')
    ])

    model.compile(loss='categorical_crossentropy', optimizer=keras.optimizers.Adam(learning_rate=0.0001), metrics=['accuracy'])
    return model


def model_builder(model_type):
    if model_type == 'cnn':
        return cnn_model
    return mlp_model


if __name__ == '__main__':
    parser = argparse.ArgumentParser()
    parser.add_argument('--data_dir', help='data directory', type=str, required=True)
    parser.add_argument('--reports_dir', help='directory to store the generated classification reports', type=str, required=True)
    parser.add_argument('--model', help='optimize hyperparameters for selected model', type=str, choices=['mlp', 'cnn'])
    args = parser.parse_args()

    d1_windows, d1_labels = load_data(os.path.join(args.data_dir, 'D1'))
    d1_labels_cat = ground_truth_to_categorical(d1_labels, MAPPING)
    x, y = combine_windows(d1_windows, d1_labels_cat)

    print("Starting 10-fold cross-validation")
    cv_reports = cross_validation(x, y, model_builder(args.model), FOLDS, BATCH_SIZE, EPOCHS, LABELS)
    save_json(cv_reports, args.reports_dir, 'cv_report.json')

    print("Starting D1T training and D1E evaluation")
    (x_d1t, y_d1t), (x_d1e, y_d1e) = split_train_test(d1_windows, d1_labels_cat, TRAIN_IDS, TEST_IDS)
    model = model_builder(args.model)()
    model.fit(x_d1t, y_d1t, batch_size=BATCH_SIZE, epochs=EPOCHS, verbose=0)
    report = evaluate_model(model, x_d1e, y_d1e, LABELS)
    save_json(report, args.reports_dir, 'd1_report.json')

    print("Starting D2, D3 and D4 evaluation")
    for eval_dataset in ['D2', 'D3', 'D4']:
        windows, labels = load_data(os.path.join(args.data_dir, eval_dataset))
        labels_cat = ground_truth_to_categorical(labels, MAPPING)
        x, y = combine_windows(windows, labels_cat)
        report = evaluate_model(model, x, y, LABELS)
        save_json(report, args.reports_dir, f'{eval_dataset.lower()}_report.json')
This section describes the methodology to determine if the CSI data is stable over time carrying out a simple experiment. To do so, a new data collection is executed minimizing the disturbance of the environment by external factors. Then, an evaluation procedure is designed to determine the similarity of CSI samples collected in different time frames using DL classification models.
A dataset was collected using a TP-Link Archer C80 (one Tx antenna) and a SparkFun Thing Plus ESP32-S3 WROOM (one Rx antenna) connected to a computer. The Tx and Rx were placed on a table, separated by \(1\) meter in LOS condition.The Tx device was configured to work with the standard IEEE 802.11n in the channel \(6\). The Rx device was configured to connect to the Rx and extract Wi-Fi CSI data from HT-LTF subcarriers generated by ping traffic at \(100\)Hz.
The data collection consisted of capturing CSI data from an unaltered laboratory from the university for several days: from March \(28^{th}\) to April \(1^{st}\) \(2024\), coinciding with the Easter holidays. During these days, no external human factors would have disturbed the environment and thus, the CSI data. The collected CSI samples were labelled regarding the day they were collected (i.e., \(03/29\), \(03/29\), \(03/30\), \(03/31\), \(04/01\)).
The data preparation steps described in Data preparation with minor adaptations were applied to the dataset. More concretely, given the amount of the collected data (\(24\) GB), the windowing procedure was set to arrange windows of size \(100\) without overlapping.
The script employed to execute this process is 01_4_lodo-dataset-processing.py.
"""Data preprocessing script for LODO dataset.

Processes the raw data by aranging samples in windows and process them using DBSCAN for outlier detection
and 2-level DWT for threshold based filtering.

**Example**:

    $ python 01_4_lodo-dataset-processing.py
        --input_data_path <PATH_OF_RAW_DATA>
        --windowed_data_path <PATH_TO_STORE_RESULTS>
        --window_size <WINDOW_SIZE>
"""


import argparse
import copy
import os
import sys

sys.path.append("../../..")

import numpy as np

from alive_progress import alive_bar
from libs.chapter5.pipeline.processing import proposed_method

WINDOW_SIZE = 100

def create_windows(dataset, labels, window_size=100):
    splits = np.arange(window_size, dataset.shape[1], window_size)
    return np.array(np.split(dataset, splits, axis=1)[:-1]), np.array(np.split(labels, splits, axis=0)[:-1])[:,0]


def process_windows(windows):
    windows_copy = copy.deepcopy(windows)
    with alive_bar(len(windows_copy), title=f'Processing windows', force_tty=True, refresh_secs=5) as progress_bar:
        for i, window in enumerate(i, windows_copy):
            windows_copy[i] = proposed_method(window)
            progress_bar()
    return windows_copy


def save_windowed_data(data, labels, directory):
    if not os.path.exists(directory):
        os.makedirs(directory)

    np.save(os.path.join(directory, '{0}_x.npy'), data)
    np.save(os.path.join(directory, '{0}_y.npy'), labels)


if __name__ == '__main__':
    parser = argparse.ArgumentParser()
    parser.add_argument('--input_data_path', help='Path of input data', type=str, required=True)
    parser.add_argument('--windowed_data_path', help='Path to store windowed data', type=str, required=True)
    parser.add_argument('--window_size', help='Window size', required=True, default=WINDOW_SIZE)
    args = parser.parse_args()

    amplitude_files = ['amplitudes_03_28.npy', 'amplitudes_03_29.npy', 'amplitudes_03_30.npy', 'amplitudes_03_31.npy', 'amplitudes_04_01.npy']
    labels_files = ['labels_03_28.npy', 'labels_03_29.npy', 'labels_03_30.npy', 'labels_03_31.npy', 'labels_04_01.npy']

    for amplitude_file, label_file in zip(amplitude_files, labels_files):
        print(f'Processing dataset {amplitude_file}')
        name = amplitude_file.split('_', 1)[1]
        amplitudes = np.load(os.path.join(args.input_data_path, amplitude_file))
        labels = np.load(os.path.join(args.input_data_path, label_file))

        windows, windows_labels = create_windows(amplitudes, labels, args.window_size)

        del amplitudes, labels

        windows_processed = process_windows(windows)
        save_windowed_data(windows_processed, windows_labels, os.path.join(args.windowed_data_path, name))
As HAR classifier, the model described in HAR classifier was employed, although with minor adaptations in some hyperparameters due to computational limitations caused by the high quantity of data. More concretely, the number of filters, batch size and epochs were set to \(8\), \(512\) and \(30\), respectively.
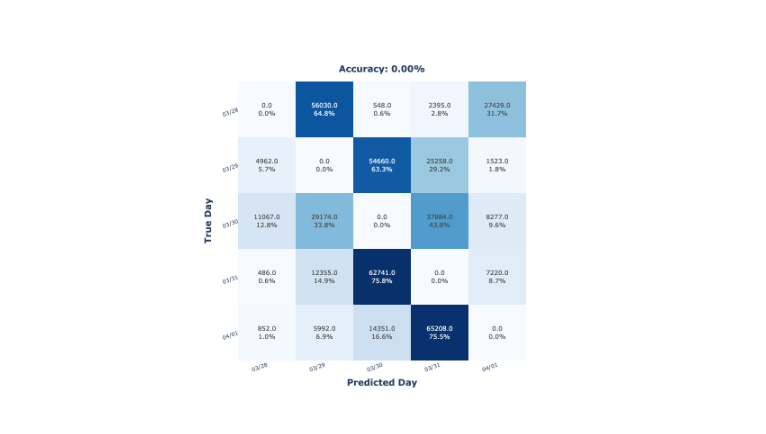
Finally, the experimental procedure consisted of a \(5\)-fold cross-validation with the processed dataset. Each fold of the cross-validation corresponds to the data collected in one day, which can be named as Leaving-One-Day-Out (LODO). This procedure aims to evaluate how the models classify data from an unseen day, having two possible outputs:
The script employed to execute this process is 03_3_lodo.py.
"""Leaving-One-Day-Out validation script

Performs a Leaving-One-Day-Out evaluation on the LODO dataset.

**Example**:

    $ python 03_3_lodo.py
        --data_dir <PATH_OF_DATA>
        --reports_dir <PATH_TO_STORE_REPORTS>
"""

import argparse
import os
import sys
sys.path.append("../../..")

import numpy as np

from tensorflow import keras
from tensorflow.keras import layers
from tensorflow.keras.utils import to_categorical

from libs.chapter5.pipeline.ml import evaluate_model
from libs.common.utils import save_json, set_seed


MAPPING = {
    '03/28': 0,
    '03/29': 1,
    '03/30': 2,
    '03/31': 3,
    '04/01': 4,
}

LABELS = ['03/28', '03/29', '03/30', '03/31', '04/01']
NUM_CLASSES = len(LABELS)

BATCH_SIZE = 512
EPOCHS = 30


def build_model():
    set_seed()

    model = keras.Sequential([
        layers.Conv2D(filters=8, kernel_size=(5,25), input_shape=(56, 100, 1)),
        layers.BatchNormalization(),
        layers.Activation('relu'),
        layers.MaxPooling2D(),

        layers.Flatten(),

        layers.Dense(512, activation='relu'),
        layers.Dense(NUM_CLASSES, activation='softmax')
    ])

    model.compile(loss='categorical_crossentropy', optimizer=keras.optimizers.Adam(learning_rate=0.0001), metrics=['accuracy'])
    return model


def train_models(datasets, labels, batch_size=BATCH_SIZE, epochs=EPOCHS, verbose=1):
    reports = []

    for i in range(len(datasets)):
        training_datasets = [datasets[j] for j in range(len(datasets)) if j != i]
        training_labels = [labels[j] for j in range(len(labels)) if j != i]
        print(f'Training with: {training_labels}')
        print(f'Testing with: {labels[i]}')

        x_train = np.vstack(training_datasets)
        y_train = one_hot_encoding(np.concatenate(training_labels), MAPPING)

        x_test = datasets[i]
        y_test = one_hot_encoding(labels[i], MAPPING)

        model = build_model()
        model.fit(x_train, y_train, batch_size=batch_size, epochs=epochs, verbose=verbose)
        report = evaluate_model(model, x_test, y_test, LABELS)
        reports.append(report)

        del x_train
        del y_train
        del x_test
        del y_test
        del training_datasets
        del training_labels
        del model

    return reports


def one_hot_encoding(y, mapping):
    return to_categorical(list(map(lambda i: mapping[i], y)), num_classes=len(mapping.keys()))


if __name__ == '__main__':
    parser = argparse.ArgumentParser()
    parser.add_argument('--data_dir', help='data directory', type=str, required=True)
    parser.add_argument('--reports_dir', help='directory to store the generated classification reports', type=str, required=True)
    args = parser.parse_args()

    windows = []
    labels = []

    for day in ['03_28', '03_29', '03_30', '03_31', '04_01']:
        windows.append(np.load(os.path.join(args.data_dir), f'{day}_x.npy'))
        labels.append(np.load(os.path.join(args.data_dir), f'{day}_y.npy'))

    reports = train_models(windows, labels)

    save_json(reports, args.reports_dir, 'reports.json')