In addition, for the sake of generalizability, datasets must be collected from heterogeneous subjects to include different ways of performing the same activity, which are mostly determined by age, gender or other physiological features.
Therefore, we collected a dataset addressing the aforementioned problem by selecting diverse and heterogeneous participants for data collection, bearing in mind age diversity and gender balance, thus tackling research objective RO2.
This page contains Plotly interactive figures. Sometimes, the figures might not load properly and show a blank image. Reloading the page might solve the loading issue.
Table 4.1 shows the details of the subjects and the number of activity sequences executed. Twenty-three physically healthy, white caucasian subjects (thirteen male, ten female) voluntarily participated in the data collection procedure. The age of the participants ranged from \(23\) to \(66\) years old (\(\mu = 44.3 \pm 14.3\)), where the ratio of male/female participants was \(56\%/44\%\) (Table 4.2 and Table 4.3). Informed written consent was obtained from all participants, and the data collection was approved by the ethics committee of the Universitat Jaume I (reference No. CD/88/2022) and carried out in accordance with the Declaration of Helsinki.
Code
subjects_info = load_subjects_info()subjects_info
Table 4.1: Subject’s information
subject_id
age
gender
height
weight
dominant_hand
executions
0
s01
54
M
190
83
R
6
1
s02
31
M
171
71
R
9
2
s03
24
F
161
62
R
10
3
s04
51
M
174
60
R
10
4
s05
54
M
172
85
R
10
5
s06
53
M
179
110
R
10
6
s07
49
M
176
88
R
11
7
s08
63
M
165
89
R
9
8
s09
28
F
164
49
R
10
9
s10
66
F
165
72
R
10
10
s11
50
M
181
70
R
10
11
s12
46
M
181
90
R
10
12
s13
26
M
170
65
R
10
13
s14
34
M
170
65
R
10
14
s15
23
F
166
60
R
10
15
s16
25
M
173
64
L
10
16
s17
58
F
156
53
R
10
17
s18
61
M
172
97
R
10
18
s19
30
F
160
58
R
10
19
s20
58
F
160
60
R
10
20
s21
56
F
160
55
R
10
21
s22
31
F
162
70
R
9
22
s23
48
F
174
78
R
9
Code
subjects_age_range(subjects_info)
Table 4.2: Subject’s statistics
count
mean
std
min
25%
50%
75%
max
age
23.0
44.304348
14.293784
23.0
30.5
49.0
55.0
66.0
Code
subjects_age_range_by_gender(subjects_info)
Table 4.3: Subject’s statistics by gender
age
count
mean
std
min
25%
50%
75%
max
gender
F
10.0
42.200000
16.551603
23.0
28.5
39.5
57.5
66.0
M
13.0
45.923077
12.750566
25.0
34.0
50.0
54.0
63.0
Devices
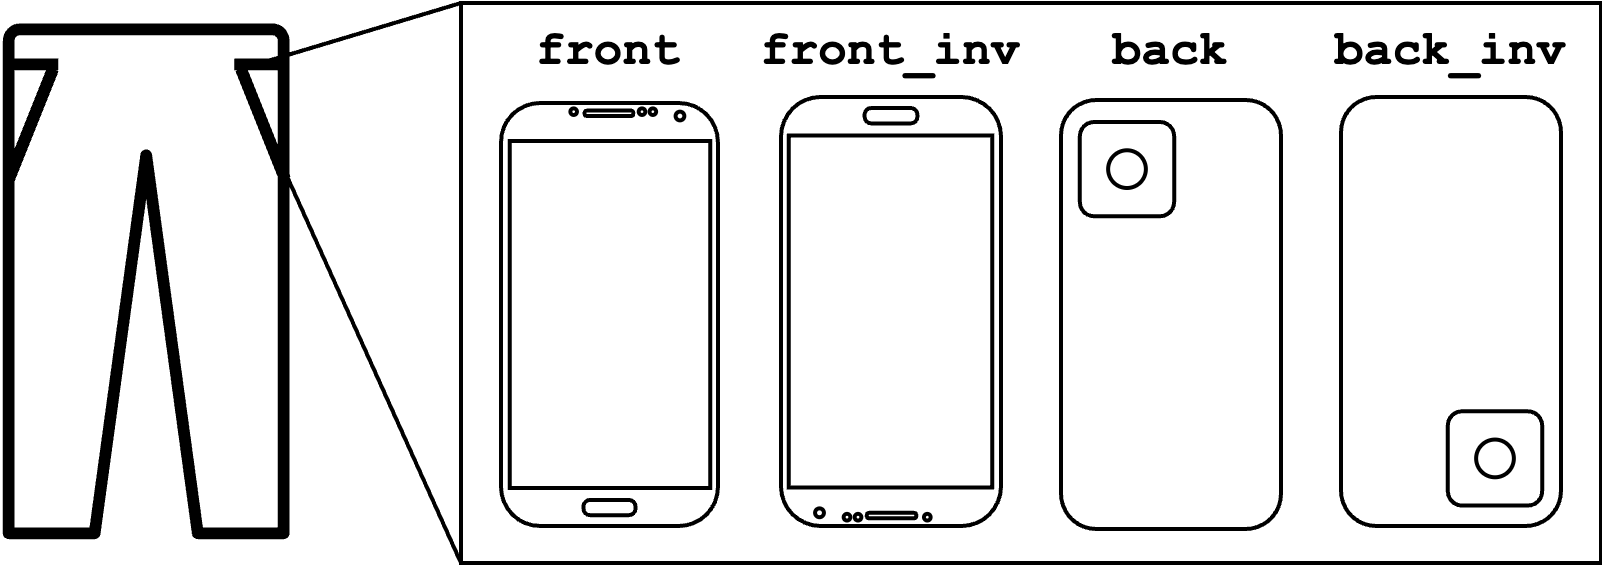
A Xiaomi Poco X3 Pro smartphone (M2102J20SG) and a TicWatch Pro 3 GPS smartwatch (WH12018), both equipped with an STMicroelectronics LSM6DSO IMU sensor 1, were used to collect accelerometer and gyroscope data. The devices had a custom application installed —smartphone app (Matey-Sanz and González-Pérez 2022a), smartwatch app (Matey-Sanz and González-Pérez 2022b)— to collect sensor samples at \(100\)Hz. These apps were developed using the libraries described in Data collection libraries on top of the AwarNS Framework. The smartwatch was worn on the left wrist; the smartphone was carried in the front left trousers pocket, letting the participants choose the device orientation in their pockets (see Figure 4.1).
Accelerometer: range (\(\pm8g\)), accuracy (\(\pm0.02g\))
Gyroscope: range (\(\pm1000dpi\)), accuracy (\(\pm1dpi\))
Smartwatch specs:
Accelerometer: range (\(\pm8g\)), accuracy (\(\pm0.02g\))
Gyroscope: range (\(\pm2000dpi\)), accuracy (\(\pm1dpi\))
Figure 4.1: Different orientations of the smartphone placed in the pocket
Another device, a Xiaomi Poco F2 Pro smartphone (M2004J11G), was used to video-record the subjects while performing the data collection procedure at \(60\) frames per second for data labelling (i.e. ground truth) purposes.
Collection environment
The data collection was executed in a research laboratory at Universitat Jaume I. An obstacle-free, three-meter-long and two-meter-wide area with a flat ceramic floor and a combination of natural and artificial light was prepared to carry out the collection.
An armless chair was placed in one longitudinal extreme of the area and a visible floor mark was put in the opposite extreme. Thus, the chair and the floor mark were separated by three meters.
The environment was only occupied by a participant and a researcher to avoid any distraction or interference during the data collection. In addition to the smartphone used to video-record the collection and the personal devices of the participant, no other devices were enabled in the environment that could interfere with the data collection process.
Experimental procedure
Each participant was asked to perform a specific sequence of activities that corresponds with the TUG test – a well-known mobility test typically used for fall risk assessment (Podsiadlo and Richardson 1991). The test starts from a seated position on a chair and each subject was then instructed to perform the following sequence of activities: standing up from the chair, walking three meters (indicated with a mark on the ground), turning around (\(180º\)), walking back to the chair, turning around (\(180º\)), and sitting down on the chair. The participants were free to choose the direction of their turns (i.e., left or right). In summary, five unique activities were performed: SEATED, STANDING_UP, WALKING, TURNING and SITTING_DOWN.
Each subject was instructed to perform the sequence of activities ten times, although some sequence executions were discarded due to non-compliance with the procedure (e.g., incorrect start of data collection, poor sequence execution, etc.). A total amount of \(223\) executions (Table 4.4) compose the dataset.
Each activity sequence was video-recorded by a researcher. Then, each video was manually analyzed at frame level to determine the transitions between the executed activities and label the collected samples with the corresponding activity to establish the groundtruth.
Code
executions_by_gender(subjects_info)
Table 4.4: Total amount of executions
gender
F
M
Total
executions
98
125
223
Collected dataset
Data description
Code
data = load_data()
The collected dataset contains raw (i.e., no preprocessing steps applied) accelerometer and gyroscope samples from a smartphone and a smartwatch labelled with a certain human activity. Even though the devices’ clocks are synchronised, the samples of each device are not synchronized with each other since the data collection on both devices are independent processes. In other words, a data sample at timestamp \(X\) in the smartphone data might not have an equivalent sample exactly at the same timestamp \(X\) in the smartwatch data.
The dataset is organized in CSV files named using the XX_YY_DEV.csv pattern, where XX is the id of the subject, YY is the execution number and DEV is the device used to collect the data contained in the file (i.e., sp or sw). Then, each row of the CSV file contains an accelerometer and gyroscope sample labelled with an activity and annotated with a timestamp.
Table 4.5 contains the number of collected samples for each activity. Even though the sampling rate used in the data collection applications was set to \(100\)Hz, Android applications are not always able to apply the requested sampling rate, resulting in an average sampling rate of \(102\)Hz for the smartphone and \(104\)Hz for the smartwatch.
Code
count_samples(data)
Table 4.5: Number of collected samples
SEATED
STANDING_UP
WALKING
TURNING
SITTING_DOWN
TOTAL
sp
32764
27303
115069
52209
31868
259213
sw
32025
27765
117126
53180
32457
262553
As an example of the type of data captured for one subject, Figure 4.2 and Figure 4.3 show a plot of the accelerometer and gyroscope samples collected respectively from the smartphone and the smartwatch by the subject s16 on his first execution (i.e., files s16_01_sp.csv and s16_01_sw.csv).
Figure 4.3: Sample of smartwatch collected accelerometer (top) and gyroscope (bottom) data.
Finally, Table 4.6 contains information about each execution. In particular, it contains the phone orientation (see Figure 4.1) and the turning direction (left or right) for each execution.
Code
from itables import showexecutions_info = load_executions_info()show(executions_info)
From the above table, some statistics can be extracted, such as the amount of times each orientation has been employed (Figure 4.4), the number of right and left turns in first_turn and second_turn (Figure 4.5), or the direction of the first_turn and second_turn as a sequence (Figure 4.6).
Code
plot_orientation_stats(executions_info)
Figure 4.4: Phone orientation in the pocket.
Code
plot_turn_direction_stats(executions_info)
Figure 4.5: Direction of turns in the first_turn and second_turn activities.
Figure 4.6: Combined direction of turns in each sequence.
Limitations
The main technical limitation of the data described in this section resides in the data labelling procedure. Data labelling was performed by visual inspection of videos recorded at \(60\) frames per second, which implies that the time resolution of the video was \(16.6\)ms. However, due to hardware limitations, sometimes two adjacent frames were repeated, reducing the time resolution to \(33.2\)ms in specific time frames. On the other hand, the resolution of the sensors used for data collection was about \(10\)ms. Due to this resolution mismatch, there is a possible drift of up to three sensor samples, compared to the video recording. Therefore, some samples collected during the transition between activities might be mislabeled (e.g., a WALKING sample might be mislabelled as a TURNING sample).
In addition, unintentional errors could have been introduced during the manual video-recording inspection and corresponding labelling process. Concerning the sampling rate, we note some minor variability which is imposed by the Android operating system and thus represents a real-world data collection process.
Finally, while user heterogeneity regarding age and gender was ensured, there is an imbalance in handedness with a majority (\(22\) out of \(23\)) of participants being right-handed.
Comparison with other datasets
Table 4.7 compares the datasets taking into account the number of activities, the number, age and gender distribution of subjects, and the number of different devices employed in the data collection, and the device position in subjects’ body. In terms of the number of activities, the collected dataset is limited compared to ExtraSensory, WISDM and DOMINO, being its weakest point of comparison. ExtraSensory contains up to \(10\) times more activities since the authors performed a data collection process in an uncontrolled manner because data labelling was delegated to participating users.
Regarding the subjects, the collected dataset presents the most variate sample in terms of age, and similar gender balance as ExtraSensory and RealWorld, while having a decent amount of participants, but still far from ExtraSensory and WISDM numbers. Finally, the collected dataset is also limited in terms of devices since we only used a smartphone and a smartwatch for collecting data, while several device models were used in HHAR (four smartphones and two smartwatch models), ExtraSensory (fifteen smartphone models, since each participant used its own smartphone) and WISDM (two smartphone models).
Arrotta, Luca, Gabriele Civitarese, Riccardo Presotto, and Claudio Bettini. 2023. “DOMINO: A Dataset for Context-Aware Human Activity Recognition Using Mobile Devices.” In 2023 24th IEEE International Conference on Mobile Data Management (MDM), 346–51. IEEE. https://doi.org/10.1109/MDM58254.2023.00063.
Matey-Sanz, Miguel, Sven Casteleyn, and Carlos Granell. 2023a. “Dataset of Inertial Measurements of Smartphones and Smartwatches for Human Activity Recognition.”Data in Brief 51: 109809. https://doi.org/10.1016/j.dib.2023.109809.
———. 2023b. “Smartphone and smartwatch inertial measurements from heterogeneous subjects for human activity recognition.” Zenodo. https://doi.org/10.5281/zenodo.8398688.
Podsiadlo, Diane, and Sandra Richardson. 1991. “The Timed ‘up & Go’: A Test of Basic Functional Mobility for Frail Elderly Persons.”Journal of the American Geriatrics Society 39 (2): 142–48. https://doi.org/10.1111/j.1532-5415.1991.tb01616.x.
Stisen, Allan, Henrik Blunck, Sourav Bhattacharya, Thor Siiger Prentow, Mikkel Baun Kjærgaard, Anind Dey, Tobias Sonne, and Mads Møller Jensen. 2015. “Smart Devices Are Different: Assessing and Mitigating Mobile Sensing Heterogeneities for Activity Recognition.” In Proceedings of the 13th ACM Conference on Embedded Networked Sensor Systems, 127–40. https://doi.org/10.1145/2809695.2809718.
Sztyler, Timo, and Heiner Stuckenschmidt. 2016. “On-Body Localization of Wearable Devices: An Investigation of Position-Aware Activity Recognition.” In 2016 IEEE International Conference on Pervasive Computing and Communications (PerCom), 1–9. https://doi.org/10.1109/PERCOM.2016.7456521.
Vaizman, Yonatan, Katherine Ellis, and Gert Lanckriet. 2017. “Recognizing Detailed Human Context in the Wild from Smartphones and Smartwatches.”IEEE Pervasive Computing 16 (4): 62–74. https://doi.org/10.1109/MPRV.2017.3971131.
Weiss, Gary M, Kenichi Yoneda, and Thaier Hayajneh. 2019. “Smartphone and Smartwatch-Based Biometrics Using Activities of Daily Living.”IEEE Access 7: 133190–202. https://doi.org/10.1109/ACCESS.2019.2940729.