| Value | ||
|---|---|---|
| Model | Hyperparameter | |
| Loading... (need help?) |
Multidimensional Analysis of ML and DL on HAR
The ML and DL techniques are powerful tools to solve a wide variety of problems and develop applications. The usage of these tools requires bearing in mind several dimensions for the success of the analysis.
The first dimension is the amount of data required to train the ML or DL model. Researchers usually agree that “the more data, the better”, however, the data collection procedures are time- and resource-expensive. Researchers hereby face the challenge of deciding how much data they will need to meet the requirements of their study, i.e., to not collect less or more data than required.
The second dimension involves the type of data that will be employed, i.e., data source. Researchers need to determine which device among all the possibilities they are going to use and how they are going to use it (e.g., sensor placement) in their research.
The third dimension is the choice of a ML or DL model. This choice can be a paramount step in a research, since some models could perform significantly better or worse than others depending on the nature and quantity of training data, leading to the success or failure of the research.
In this chapter, we analyse these dimensions using the dataset and the variety of and methods described in the previous section. The aim is, in the context of HAR, 1) to determine how the amount of data impacts the performance of the models, while also investigating 2) which data source from the dataset (i.e., smartphone, smartwatch or fused) yields the best results across models and 3) which model provides the best results given a specific data source.
The contents on this section correspond with the Chapter 3 of the dissertation document and constitute an extension of the work “Analysis and Impact of Training Set Size in Cross-Subject Human Activity Recognition” (Matey-Sanz et al. 2024) presented in the \(27^{th}\) Iberoamerican Congress on Pattern Recognition (CIARP).
Methodology
The collected dataset in Smartphone and smartwatch HAR dataset and the ML and DL techniques described in ML and DL have been used to carry out the specified analysis. The following sections describe specific procedures for data preparation, the process to optimize the hyperparameters of the selected models, and the procedure to evaluate the impact of the amount of training data.
Data preparation
Min-Max scaling
A Min-Max scaling was applied to the smartphone and smartwatch data to rescale the data into the \([-1, 1]\) range. This rescaling is defined as: \[ v' = \frac{v - min}{max - min}*(new\_max-new\_min) + new\_min \]
Data fusion
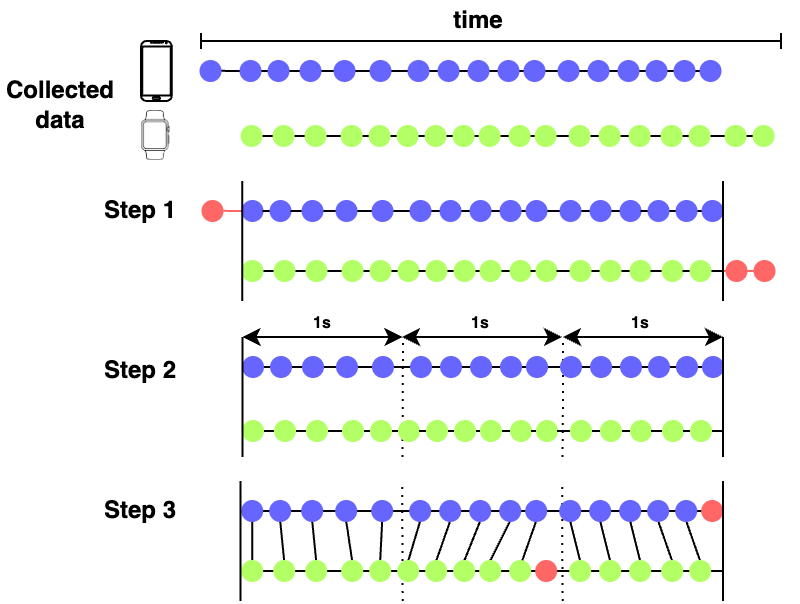
A fused dataset was generated to evaluate the impact of the training set size when using smartphone and smartwatch data together. Due to variable sampling rates (\(102\) Hz and \(104\) Hz for smartphone and smartwatch), the following procedure (depicted in Figure 1) was employed to fusion both data sources:
- Since the data collection is started and finalized in each device independently, exceeding samples at the beginning and end of the execution are removed (red dots in Figure 1, step 1).
- Samples are grouped in batches of \(1\) second.
- In each batch, the \(i^{th}\) smartphone sample is matched with the \(i^{th}\) smartwatch sample. A sample is discarded if it cannot be matched with another sample (red dots in Figure 1, step 3).
Data windowing
The smartphone, smartwatch and fused dataset were split using the sliding window technique. A window size of \(50\) samples was used, corresponding to approximately \(0.5\) seconds with a \(100\) Hz sampling rate, and an overlap of \(50\) %. These values have been chosen since they are proven to obtain successful results in HAR (Sansano et al. 2020; Jaén-Vargas et al. 2022). Table 1 contains the resulting windowns in each datasets, ready to be used by the CNN, LSTM and CNN-LSTM models.
| Dataset | SEATED | STANDING_UP | WALKING | TURNING | SITTING_DOWN | Total |
|---|---|---|---|---|---|---|
| Smartphone | 1033 | 1081 | 4606 | 2087 | 1235 | 10042 |
| Smartwatch | 998 | 1105 | 4691 | 2123 | 1253 | 10170 |
| Fused | 871 | 1083 | 4458 | 1887 | 1066 | 9365 |
Feature extraction
A feature extraction process is executed to use the collected data in MLP models. The extracted features can be classified in mathematical/statistical or angular features:
- Mathematical/Statistical features are extracted by applying mathematical/statistical functions to the collected data. Although simple, these features are beneficial for discriminating between static and dynamic activities, postures, etc. (Figo et al. 2010). The extracted features are the mean, median, maximum, minimum, sd, range and rms. Each feature is extracted from each sensor (i.e., accelerometer and gyroscope) and axis (i.e., x, y and z).
- Angular features are useful to determine orientation changes of the devices and in combination with the mathematical/statistical features improve the classification accuracy of the models (Coskun, Incel, and Ozgovde 2015). The angular features extracted are the Pitch, the Roll and the Rotational angle for each axis.
For the smartphone and smartwatch datasets, a total of \(47\) (i.e., \(7*6+1+1+3\)) features were extracted from each window in each dataset. In the case of the fused dataset, \(94\) (i.e., \(47*2\)) features were extracted from each window.
The script employed to execute this process is 01_data-processing.py.
Code
"""Data preprocessing script.

Processes the raw data by: applying min-max scaling, fusing smartphone and smartwatch data, arange samples
in windows and perform feature extraction. The script stores the raw windows, windows with features extracted
and groundtruth for smartphone, smartwatch and fused data.

**Example**:

    $ python 01_data-processing.py --input_data_path <PATH_OF_RAW_DATA> --windowed_data_path <PATH_TO_STORE_RESULTS>
"""


import argparse
import os
import numpy as np
import sys

sys.path.append("../../..")

from alive_progress import alive_bar
from libs.chapter2.data_loading import load_data
from libs.chapter3.pipeline.feature_extraction import apply_feature_extraction
from libs.chapter3.pipeline.data_fusion import fuse_data
from libs.chapter3.pipeline.raw_data_processing import scale, windows, compute_best_class, count_data


WINDOW_SIZE = 50
STEP_SIZE = WINDOW_SIZE // 2


def clean_raw_data(raw_data):
    clean_data = {}

    with alive_bar(len(raw_data), title=f'Data cleanning', force_tty=True, monitor='[{percent:.0%}]') as progress_bar:
        for desc, data in raw_data.items():
            _, source = desc.rsplit('_', 1)
            clean_data[desc] = scale(data, source)
            progress_bar()

    return clean_data


def fuse_sources(clean_data):
    fused_clean_data = {}
    for execution, data in clean_data.items():
        *exec_id, device = execution.split('_')
        exec_id = '_'.join(exec_id)

        if not exec_id in fused_clean_data:
            fused_clean_data[exec_id] = {}
        fused_clean_data[exec_id][device] = data

    for execution, data in fused_clean_data.items():
        fused = fuse_data(data['sp'], data['sw'])
        clean_data[f'{execution}_fused'] = fused

    return clean_data


def get_windowed_data(clean_data, window_size, step_size):
    windowed_data = {}
    gt = {}

    with alive_bar(len(clean_data), title=f'Data windowing', force_tty=True, monitor='[{percent:.0%}]') as progress_bar:
        for desc, data in clean_data.items():
            desc_components = desc.split('_')
            subject_sensor_desc = f'{desc_components[0]}_{desc_components[2]}'

            windowed_df = windows(data, window_size, step_size)
            desc_instances = []
            desc_gt = []

            columns = ['x_acc', 'y_acc', 'z_acc', 'x_gyro', 'y_gyro', 'z_gyro'] if desc_components[2] != 'fused' else ['x_acc_sp', 'y_acc_sp', 'z_acc_sp', 'x_gyro_sp', 'y_gyro_sp', 'z_gyro_sp',
                         'x_acc_sw', 'y_acc_sw', 'z_acc_sw', 'x_gyro_sw', 'y_gyro_sw', 'z_gyro_sw']

            for i in range(0, data.shape[0], step_size):
                window = windowed_df.loc["{0}:{1}".format(i, i+window_size)]
                values = window[columns].transpose()
                groundtruth = compute_best_class(window)
                if (values.shape[1] != window_size):
                    break
                desc_instances.append(values.values.tolist())
                desc_gt.append(groundtruth.values[0])

            if subject_sensor_desc in windowed_data:
                windowed_data[subject_sensor_desc] += desc_instances
                gt[subject_sensor_desc] += desc_gt
            else:
                windowed_data[subject_sensor_desc] = desc_instances
                gt[subject_sensor_desc] = desc_gt

            progress_bar()

    return windowed_data, gt


def extract_features(windowed_data):
    featured_data = {}
    with alive_bar(len(windowed_data.items()), title=f'Feature extraction', force_tty=True, monitor='[{percent:.0%}]') as progress_bar:
        for subject, windows in windowed_data.items():
            data_type = subject.split('_')[-1]
            features = []
            for window in windows:
                window = np.array(window)
                if data_type != 'fused':
                    features.append(apply_feature_extraction(window))
                else:
                    part_a = window[:6,:]
                    part_b = window[6:,:]

                    features_a = apply_feature_extraction(part_a)
                    features_b = apply_feature_extraction(part_b)
                    features.append(np.concatenate((features_a, features_b)))

            featured_data[subject] = np.array(features)
            progress_bar()
    return featured_data


def store_windowed_data(windowed_data, features, ground_truth, path):
    def store_as_npy(path, data):
        with open(path, 'wb') as f:
            np.save(f, np.array(data))

    with alive_bar(len(windowed_data), title=f'Storing windowed data in {path}', force_tty=True, monitor='[{percent:.0%}]') as progress_bar:
        for desc, data in windowed_data.items():
            subject = desc.split('_')[0]
            subject_path = os.path.join(path, subject)
            if not os.path.exists(subject_path):
                os.makedirs(subject_path)

            store_as_npy(os.path.join(subject_path, f'{desc}.npy'), data)
            store_as_npy(os.path.join(subject_path, f'{desc}_features.npy'), features[desc])
            store_as_npy(os.path.join(subject_path, f'{desc}_gt.npy'), ground_truth[desc])
            progress_bar()


if __name__ == '__main__':
    parser = argparse.ArgumentParser()
    parser.add_argument('--input_data_path', help='Path of input data', type=str, required=True)
    parser.add_argument('--windowed_data_path', help='Path to store windowed data', type=str, required=True)
    args = parser.parse_args()

    raw_data = load_data(args.input_data_path)

    clean_data = clean_raw_data(raw_data)
    clean_fused_data = fuse_sources(clean_data)

    print('\nClean data:')
    print(count_data(clean_fused_data), '\n')
    print('\n')


    windowed_data, gt = get_windowed_data(clean_fused_data, WINDOW_SIZE, STEP_SIZE)
    print('\nWindowed data:')
    print(count_data(gt), '\n')

    features = extract_features(windowed_data)
    store_windowed_data(windowed_data, features, gt, args.windowed_data_path)
Models’ hyperparameters optimization
Before training the models, their hyperparameters have to be selected, i.e., the models have to be tuned. The selected options for the hyperparameters, which have been chosen based on other works using these models, are the following:
- Number of units (all models): \(128\), \(256\) and \(512\).
- Number of filters (CNN and CNN-LSTM): \(32\), \(64\) and \(128\).
- LSTM cells (LSTM and CNN-LSTM): \(32\), \(64\), \(128\).
Other hyperparamters (e.g., learning rate, filter sizes, number of layers) were selected based on previous experience.
The best hyperparameters were obtained using the Grid Search technique, where every possible combination of hyperparameters is evaluated. The process was configured to train and evaluate each combination five times using the Adam optimizer during \(50\) epochs with a batch size of \(64\) windows. To reduce the computational cost of the optimization, the process was carried out in two phases: 1) optimization of layers and learning hyperparameters and 2) optimization of the number of layers. Table 2 shows the best combination of hyperparameters per model and dataset.
The script employed to execute this process is 02_hyperparameter-optimization.py.
Code
"""Hyperparameters Grid Search script.

Performs an hyperparameter Grid Search on the specified model. The selected hyperparameters for the search
can be found in `tuning_configuration.py`.

**Example**:

    $ python 02_hyperparameter-optimization.py
        --data_dir <PATH_OF_DATA>
        --model <MLP,CNN,LSTM,CNN-LSTM>
        --phase <initial,extra-layers>
        --batch_size <BATCH_SIZE>
        --epochs <EPOCHS>
        --executions <EXECUTIONS>
"""


import argparse
import os

import sys
sys.path.append("../../..")

from libs.chapter3.pipeline.data_reshapers import get_reshaper
from libs.chapter3.pipeline.hyperparameters_tuning import get_model_builder, create_tuner, tune, get_tuning_summary
from libs.chapter3.pipeline.tuning_configuration import get_tuning_configuration
from libs.common.data_loading import load_data
from libs.common.data_grouping import merge_subjects_datasets
from libs.common.utils import save_json, set_seed


TUNING_DIR = 'GRID_SEARCH_{0}'
TUNING_SUMMARY_FILE = 'summary.json'

ACTIVITIES = {"SEATED": 0, "STANDING_UP": 1, "WALKING": 2, "TURNING": 3, "SITTING_DOWN": 4}

BATCH_SIZE = 64
EPOCHS = 50
N_EXECUTIONS = 5


def tune_model(data, model_type, batch_size, epochs, n_executions, phase):
    set_seed()
    model_builder = get_model_builder(model_type)
    reshaper = get_reshaper(model_type)
    optimizing_layers = phase == 'extra-layers'

    for source, (x, y) in data.items():
        x, y = merge_subjects_datasets(x, y, list(x.keys()))
        if reshaper is not None:
            x = reshaper(x)

        features_dimension = x.shape[-1] if model_type in ['lstm', 'cnn-lstm'] else x.shape[1]
        tuning_configuration = get_tuning_configuration(model_type, source if optimizing_layers else None)
        tuning_configuration['features_dimension'] = features_dimension
        tuning_project = f'{model_type}_{source}{"_layers" if optimizing_layers else ""}'
        print(f'Tuning {model_type} model with {source} data')
        tuner = create_tuner(
            model_builder,
            n_executions,
            tuning_configuration,
            TUNING_DIR.format(phase),
            tuning_project
        )

        tuner = tune(tuner, x, y, epochs, batch_size)
        save_tuning_summary(tuner, os.path.join(TUNING_DIR, tuning_project))


def save_tuning_summary(tuner, tuning_dir):
    save_json(get_tuning_summary(tuner), tuning_dir, TUNING_SUMMARY_FILE)


if __name__ == '__main__':
    parser = argparse.ArgumentParser()
    parser.add_argument('--data_dir', help='data directory', type=str, required=True)
    parser.add_argument('--model', help='optimize hyperparameters for selected model', type=str, choices=['mlp', 'lstm', 'cnn', 'cnn-lstm'])
    parser.add_argument('--phase', help='tuning phase: <initial> to tune layer hyperparameters and <extra-layers> to tune number of layers' , type=str, choices=['initial', 'extra-layers'])
    parser.add_argument('--batch_size', help='training batch size', type=int, default=BATCH_SIZE)
    parser.add_argument('--epochs', help='training epochs', type=int, default=EPOCHS)
    parser.add_argument('--executions', help='executions per trial', type=int, default=N_EXECUTIONS)
    args = parser.parse_args()

    use_raw_data = args.model != 'mlp'

    x_sp, y_sp = load_data(args.data_dir, 'sp', use_raw_data, ACTIVITIES)
    x_sw, y_sw = load_data(args.data_dir, 'sw', use_raw_data, ACTIVITIES)
    x_fused, y_fused = load_data(args.data_dir, 'fused', use_raw_data, ACTIVITIES)
    data = {
        'sp': (x_sp, y_sp),
        'sw': (x_sw, y_sw),
	    'fused': (x_fused, y_fused)
    }
    tune_model(data, args.model, args.batch_size, args.epochs, args.executions, args.phase)
Evaluation procedure
Incremental Leaving-One-Subject-Out (ILOSO)
As pointed out by Gholamiangonabadi, Kiselov, and Grolinger (2020), the right approach to evaluate HAR systems is the LOSO (cross-subject evaluation) strategy. To study the effect of the amount of training data on the performance of models, we employ an ILOSO.
In the ILOSO strategy, given \(S\) subjects, each \(s\) subject is individually considered as a test subject. Then, \(n\) subjects are randomly selected as training subjects from \(S\setminus s\), where \(n \in [1,\ldots,|S|-1]\). The data from training subjects are employed to train a model and the data from the test subject is used to evaluate it. This procedure is repeated \(R\) times for every value of \(n\) with different random initialization of the model.
The described algorithm trains and evaluates \(|S|*(|S|-1)*R\) models. Since we use \(R=10\) and there are three datasets and four types of models, a total of \(60720\) combinations models are trained (\(23*22*10*3*4\)).
The script employed to execute this process is 03_incremental-loso.py.
Code
"""Incremental Leaving-One-Subject-Out script.

Performs the ILOSO evaluation.

**Example**:

    $ python 03_incremental-loso.py
        --data_dir <PATH_OF_DATA>
        --reports_dir <PATH_TO_STORE_RECORDS>
        --model <MLP,CNN,LSTM,CNN-LSTM>
        --subject <EVALUATION_SUBJECT>
        --batch_size <BATCH_SIZE>
        --epochs <EPOCHS>
        --splits <SPLITS>
"""

import os
import traceback
import argparse
import gc

import sys
sys.path.append("../../..")

from alive_progress import alive_bar

from libs.chapter3.pipeline.data_grouping import generate_lno_group
from libs.chapter3.pipeline.data_reshapers import get_reshaper
from libs.chapter3.pipeline.training import create_trainer
from libs.chapter3.pipeline.training_report import report_writer
from libs.common.data_loading import load_data
from libs.common.data_grouping import generate_training_and_test_sets
from libs.common.ml import generate_report
from libs.common.utils import set_seed


ACTIVITIES = {"SEATED": 0, "STANDING_UP": 1, "WALKING": 2, "TURNING": 3, "SITTING_DOWN": 4}

BATCH_SIZE = 64
EPOCHS = 50
N_SPLITS = 10


def train_models(data, subjects, test_subjects, model_type, batch_size, epochs, n_splits, reports_dir, testing_mode):
    set_seed()
    writers = {}
    reshaper = get_reshaper(model_type)

    try:
        for test_subject in test_subjects:
            with alive_bar(len(subjects) - 1, dual_line=True, title=f'Evaluating models with {test_subject}', force_tty=True) as progress_bar:
                for n in range(1, len(subjects)):
                    for i in range(n_splits):
                        train_subjects = generate_lno_group(subjects, n, test_subject)

                        progress_bar.text = f'Training {i+1}th model with {n} subjects'
                        for source, (x, y) in data.items():
                            x_train, y_train, x_test, y_test = generate_training_and_test_sets(x, y, train_subjects, [test_subject])
                            if reshaper is not None:
                                x_train = reshaper(x_train)
                                x_test = reshaper(x_test)

                            trainer = create_trainer(model_type, source, batch_size, epochs)
                            trainer(x_train, y_train, verbose=0)
                            model, training_time = trainer(x_train, y_train, verbose=0)
                            y_pred = model.predict(x_test, verbose=0)

                            report = generate_report(y_test, y_pred, ACTIVITIES.keys())
                            report['training time'] = training_time

                            if not testing_mode:
                                if not source in writers:
                                    writers[source] = report_writer(os.path.join(reports_dir, f'{0}_models.csv'.format(f'{model_type}_{source}')))
                                writers[source](test_subject, n, i+1, report)

                            del model
                            del x
                            del y
                            del x_train
                            del y_train
                            del x_test
                            del y_test
                    gc.collect()
                    progress_bar()
    except:
        with open('failures.txt', 'a') as file:
            file.write(f'Exception in test_subject:{test_subject}, n_training_subjects:{n}, model:{model_type}, iteration: {i}\n')
            traceback.print_exc(file=file)


if __name__ == '__main__':
    parser = argparse.ArgumentParser()
    parser.add_argument('--data_dir', help='data directory', type=str, required=True)
    parser.add_argument('--reports_dir', help='directory to store reports', type=str, required=True)
    parser.add_argument('--model', help='model to use for evaluation', type=str, choices=['mlp', 'lstm', 'cnn', 'cnn-lstm'])
    parser.add_argument('--subject', help='evaluate only with specified subject', type=int)
    parser.add_argument('--batch_size', help='training batch size', type=int, default=BATCH_SIZE)
    parser.add_argument('--epochs', help='training epochs', type=int, default=EPOCHS)
    parser.add_argument('--splits', help='models trained for each case', type=int, default=N_SPLITS)
    parser.add_argument('--testing_script', help='Testing the script. Results not stored', action='store_true')
    args = parser.parse_args()

    use_raw_data = args.model != 'mlp'

    x_sp, y_sp = load_data(args.data_dir, 'sp', use_raw_data, ACTIVITIES)
    x_sw, y_sw = load_data(args.data_dir, 'sw', use_raw_data, ACTIVITIES)
    x_fused, y_fused = load_data(args.data_dir, 'fused', use_raw_data, ACTIVITIES)
    data = {
        'sp': (x_sp, y_sp),
        'sw': (x_sw, y_sw),
	    'fused': (x_fused, y_fused)
    }
    subjects = list(x_sp.keys())
    test_subjects = [subjects[args.subject - 1]] if args.subject else subjects
    train_models(data, subjects, test_subjects, args.model, args.batch_size, args.epochs, args.splits, args.reports_dir, args.testing_script)
Evaluation metrics
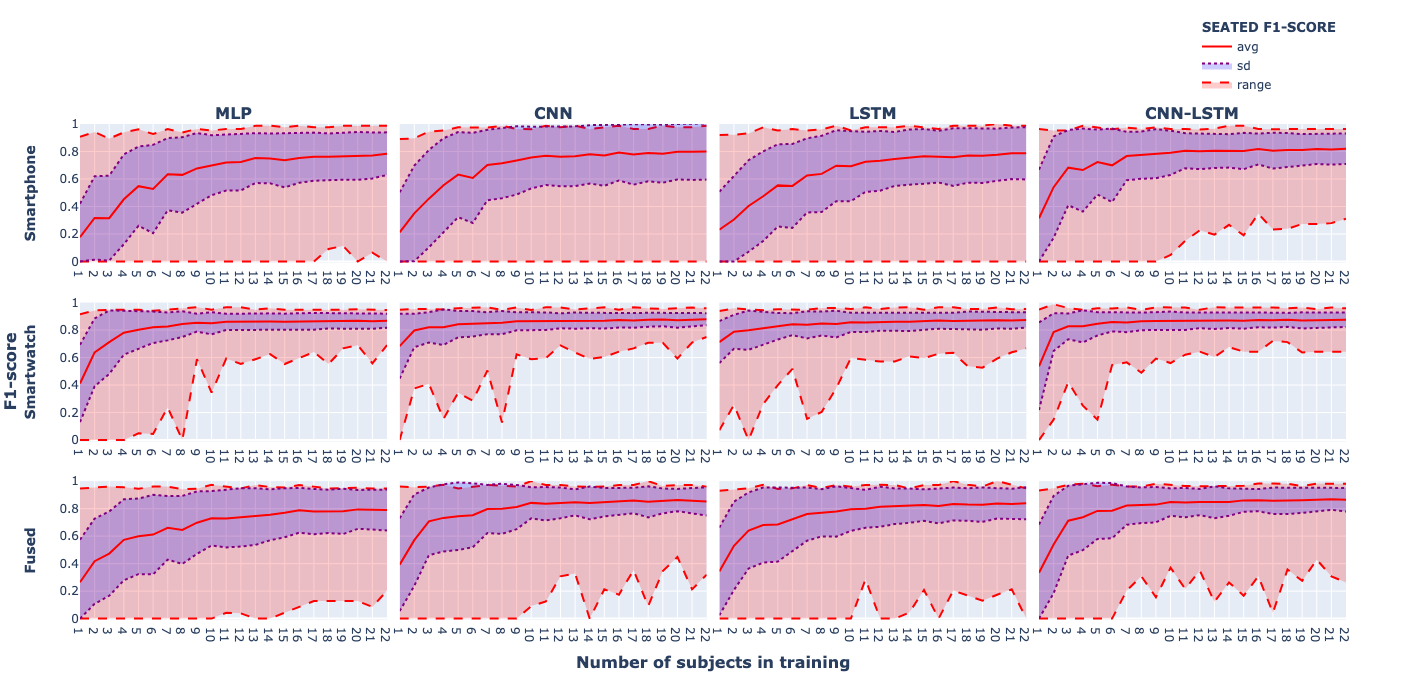
We analyse the effect of the increasing size of training data by observing the overall and activity-wise classification performance – measured using the accuracy and F1-score metrics (defined in Evaluation metrics) – of all model combinations grouped by the amount of training data (\(n\)), dataset and model type.
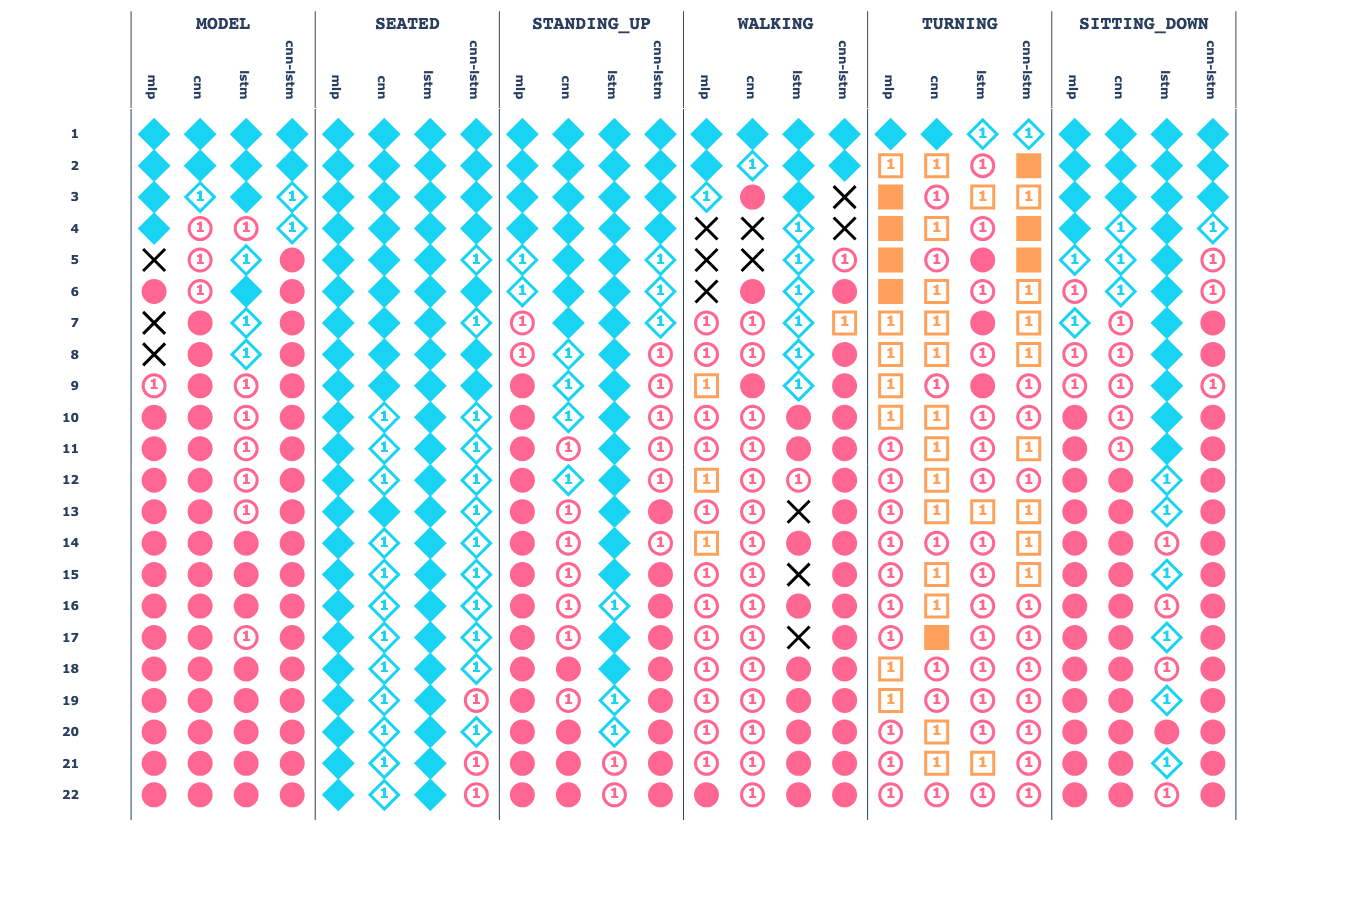
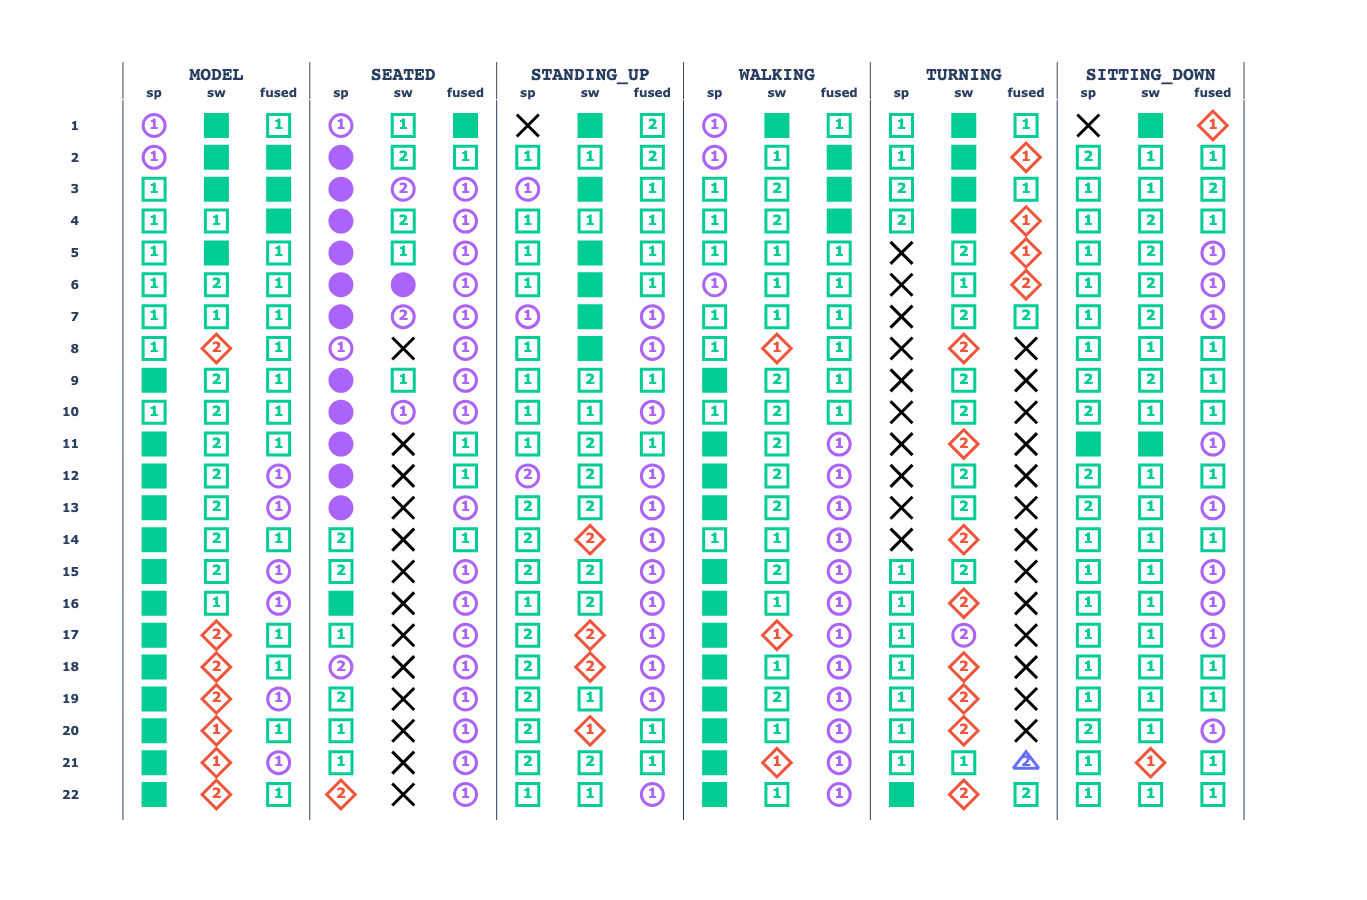
Then, based on the accuracy and F1-score metrics, descriptive statistics are computed for each value of \(n\) (i.e., the amount of training subjects), type of models and datasets to determine the effect of the increase in the training data. Finally, MWU are executed to find significant differences between the amount of data employed and the model performance, and KWH are executed to determine the best performant models and datasets (see Statistical tools).


