Splitting approach analysis
Determines which activity splitting approach provides better accuracy results.
Physical performance tests aim to assess the physical abilities and mobility skills of individuals for various healthcare purposes. They are often driven by experts and usually performed at their practice, and therefore they are resource-intensive and time-demanding. For tests based on objective measurements (e.g., duration, repetitions), technology can be used to automate them, allowing the patients to perform the test themselves, more frequently and anywhere while alleviating the expert from supervising the test. The well-known Timed Up & Go (TUG) test (Podsiadlo and Richardson 1991), typically used for mobility assessment, is an ideal candidate for automation, as inertial sensors (among others) can be deployed to detect the different movements that constitute the test without expert supervision. To evolve from expert-led testing to self-administered testing, we present a mHealth system capable of automating the TUG test using a off-the-shelve hardware, i.e., pocket-sized smartphone or a wrist smartwatch paired with a smartphone, where data from inertial sensors are used to detect the activities carried out by the patient while performing the test and compute their results in real-time. The use of both devices to automate the TUG test was evaluated and mutually compared with a reference method in terms of accuracy, statistical agreement, statistical reliability and battery consumption, proving its feasibility as a real-life mHealth application.
The contents on this section correspond with the Chapter 4 of the dissertation document, which is based in the article “Implemented and evaluating the Timed Up and Go test automation using smartphones and smartwatches” (Matey-Sanz et al. 2024) publisehd in the IEEE Journal of Biomedical and Health Informatics. This paper also constitutes an extension of the work “Instrumented Timed Up and Go Test Using Inertial Sensors from Consumer Wearable Devices” (Matey-Sanz et al. 2022) presented in the \(20^{th}\) International Conference on Artificial Intelligence in Medicine (AIME).
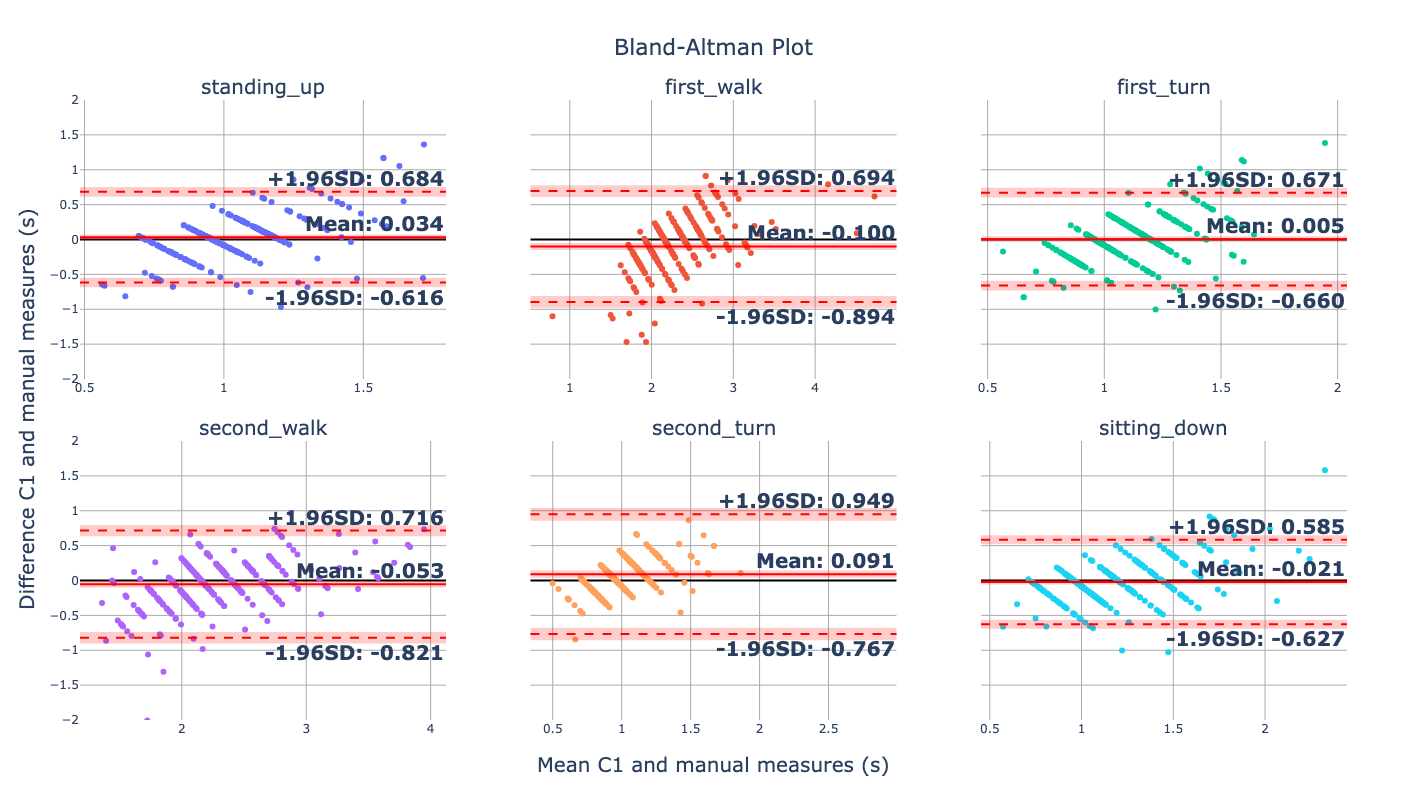
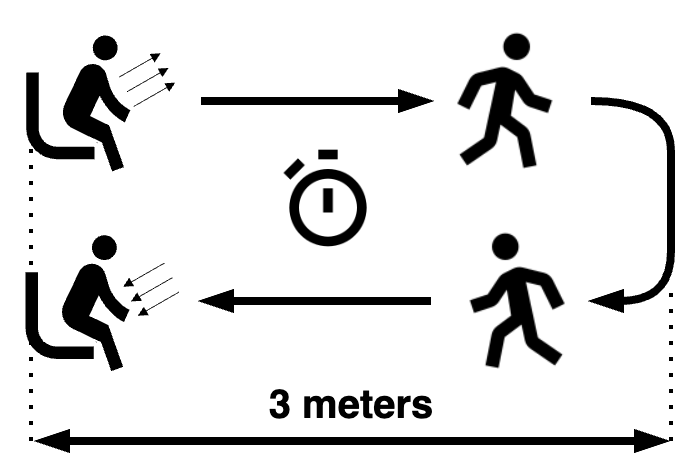
The TUG test’s main output is its total duration. Nevertheless, this measurement can be decomposed into several components (i.e., subphases) that measure different aspects of the subject’s mobility. In the literature, there seem to be different approaches to this decomposition: some authors break down the subphases of the test into stand up (from the chair), walk \(3\) meters, turn, walk back to the chair, another turn and sit down. Others consider the last two subphases into a single one combining the last turn and the sitting down activities. As will be shown in Splitting approach analysis, the best approach is the first one, where these subphases can be named as follows: standing_up, first_walk, first_turn, second_walk, second_turn and sitting_down.
These subphases can be associated with five differentiated human activities, namely SEATED, STANDING_UP, WALKING, TURNING and SITTING_DOWN. Thus, recognizing these human activities enables the automatic assessment of the TUG test. More specifically, the duration of each subphase and the total duration of the test can be obtained by calculating the boundaries between the associated recognized human activities.
This is the aim of the developed mHealth system depicted in Figure 2. The developed system has two operating modes:
C1: a WearOS smartwatch is used as a sensing device (i.e., sensor sampling) and a paired Android smartphone acts as a computing device (e.g., data processing, activity inference and results computation).C2: an Android smartphone acts as a sensing and computing device.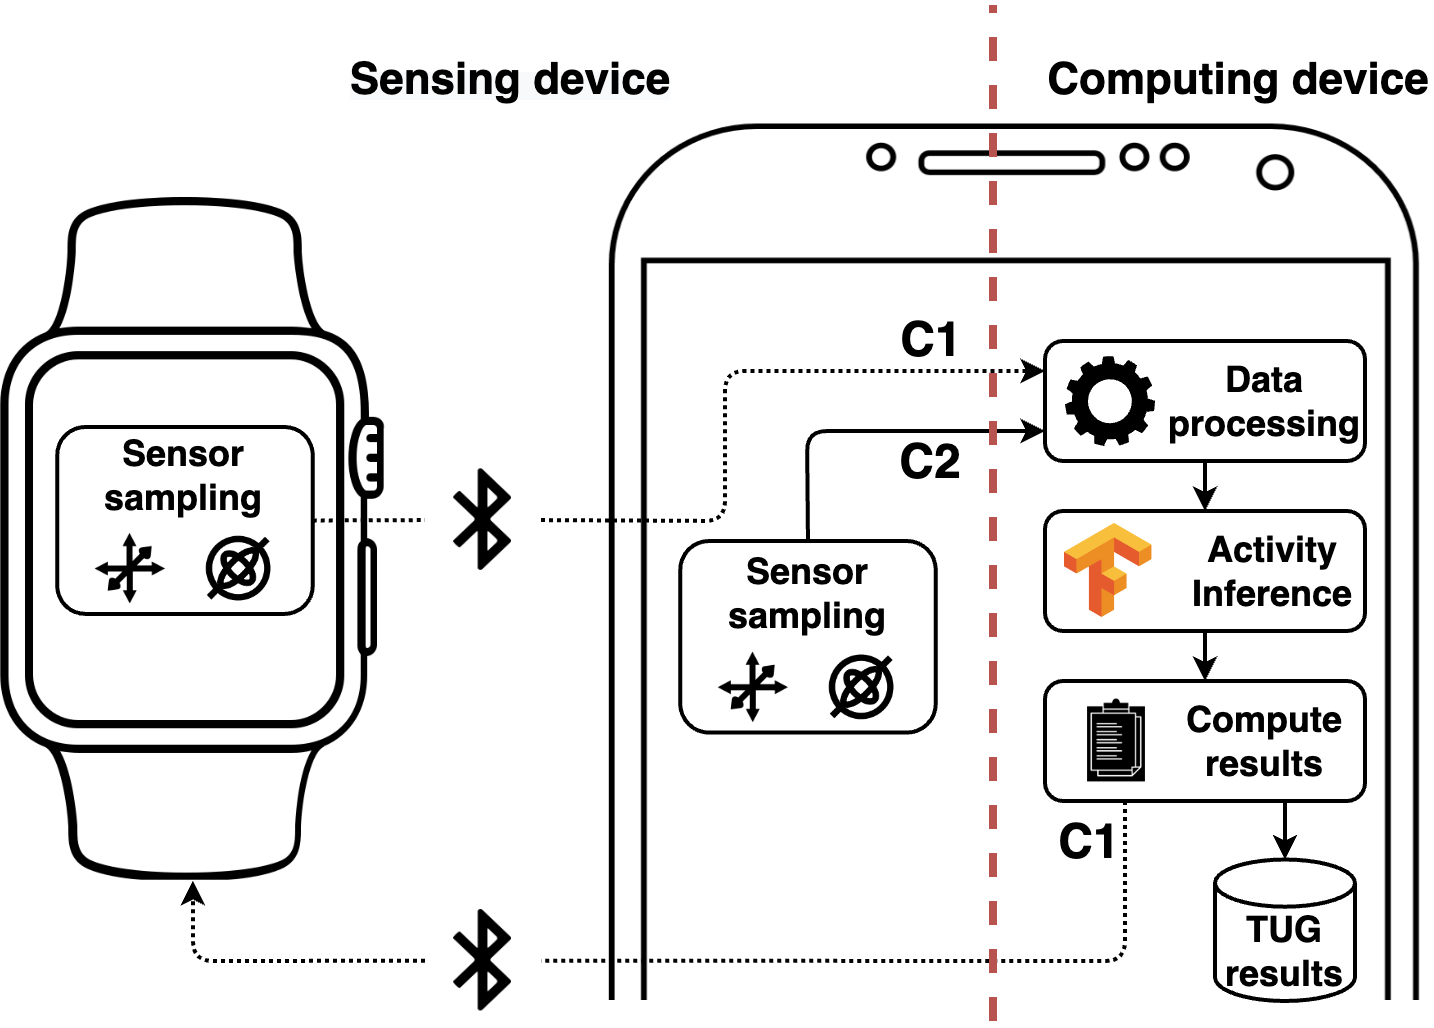
The developed system collects samples from the smartwatch (C1) or the smartphone (C2). These samples are used to determine which activity a subject performs while executing the TUG test, and to measure the duration of each subphase and the total duration of the test upon completion. Sample collection is manually initiated in both configurations, but is automatically stopped during the TUG test assessment when its completion is detected. Next, the smartwatch and smartphone applications of the TUG test system are described.
The smartwatch application is a native Android application developed using the WearOS Sensors library (described in Data collection libraries) that runs on a WearOS-based smartwatch whose main purpose is to act as a sensing device. The smartwatch must be linked to a smartphone with the application described in the next section installed, but the phone does not need to be carried on since it is used as a computing device. This is to increase the battery life of the smartwatch.
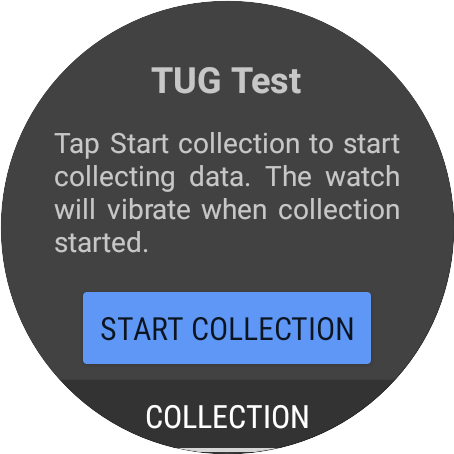
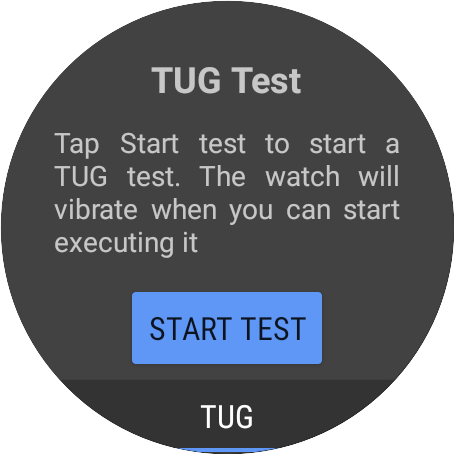
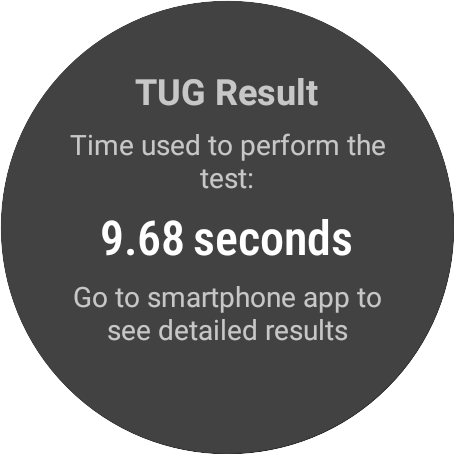
Figure 3 shows the application interface that allows the user to start the collection of accelerometer and gyroscope samples at \(100\)Hz for data collection – Figure 3 (a) – or inference – Figure 3 (b) –. After pressing the button to start the system, the smartwatch emits a vibration to indicate that the system is ready and that the collection has started. Then, collected samples are batched in groups of \(50\) and wirelessly sent to the paired smartphone using Bluetooth communication. When the end of the test is detected and its results are computed on the smartphone side, the smartwatch stops the data collection process, receives the results and vibrates to signal the end of the test, displaying the results (only the total duration, due to screen size constraints) on the screen – Figure 3 (c) –.
The TUG test smartwatch application is available in GitHub and Zenodo (Matey-Sanz and González-Pérez 2022b).
The smartphone application is a NativeScript application that runs on Android smartphones. It has been developed using the Phone Sensors, Wear OS and ML Kit packages (see Data collection libraries and ML and DL) of the AwarNS Framework (González-Pérez et al. 2023). With the application set up and running, the smartphone can act just as a computing device (C1), with a paired smartwatch as a sensing device, or as a sensing and computing device (C2).
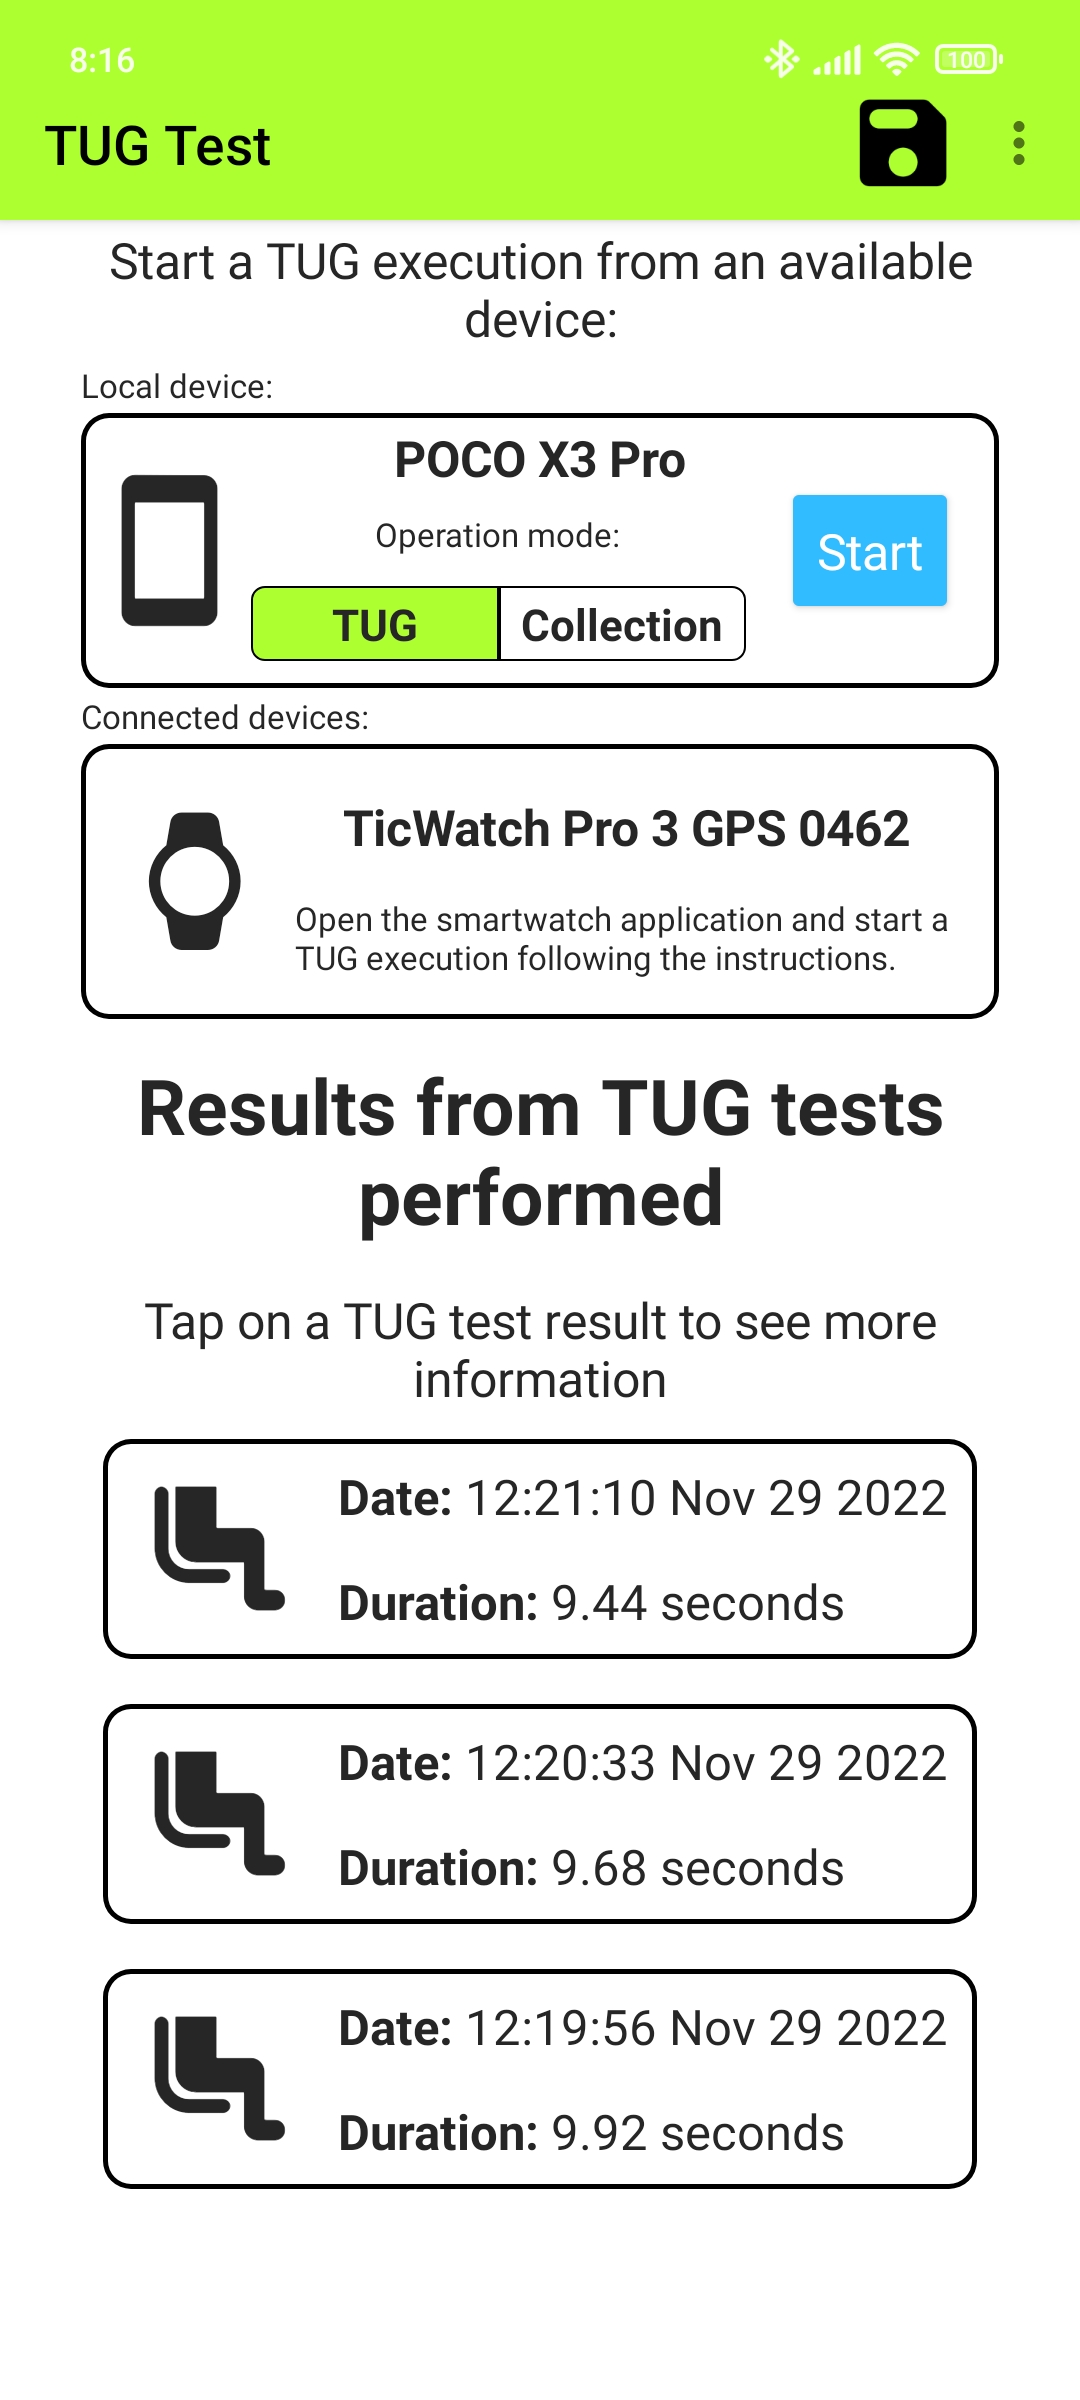
On the sensing facet, the application provides an interface to start the data collection process (Figure 4 (a)). After pressing the start button, the smartphone emits a sound to notify the user that the system is ready and the data collection has started. Like the smartwatch application, it collects accelerometer and gyroscope data at \(100\)Hz. On the computing facet, the application processes the collected data (either from the smartwatch or from the phone itself) by applying a temporal alignment, Min-Max scaling and data windowing. Once a data window is prepared, the bundle is used as input to an embedded ML or DL model that predicts which activity the subject is performing.
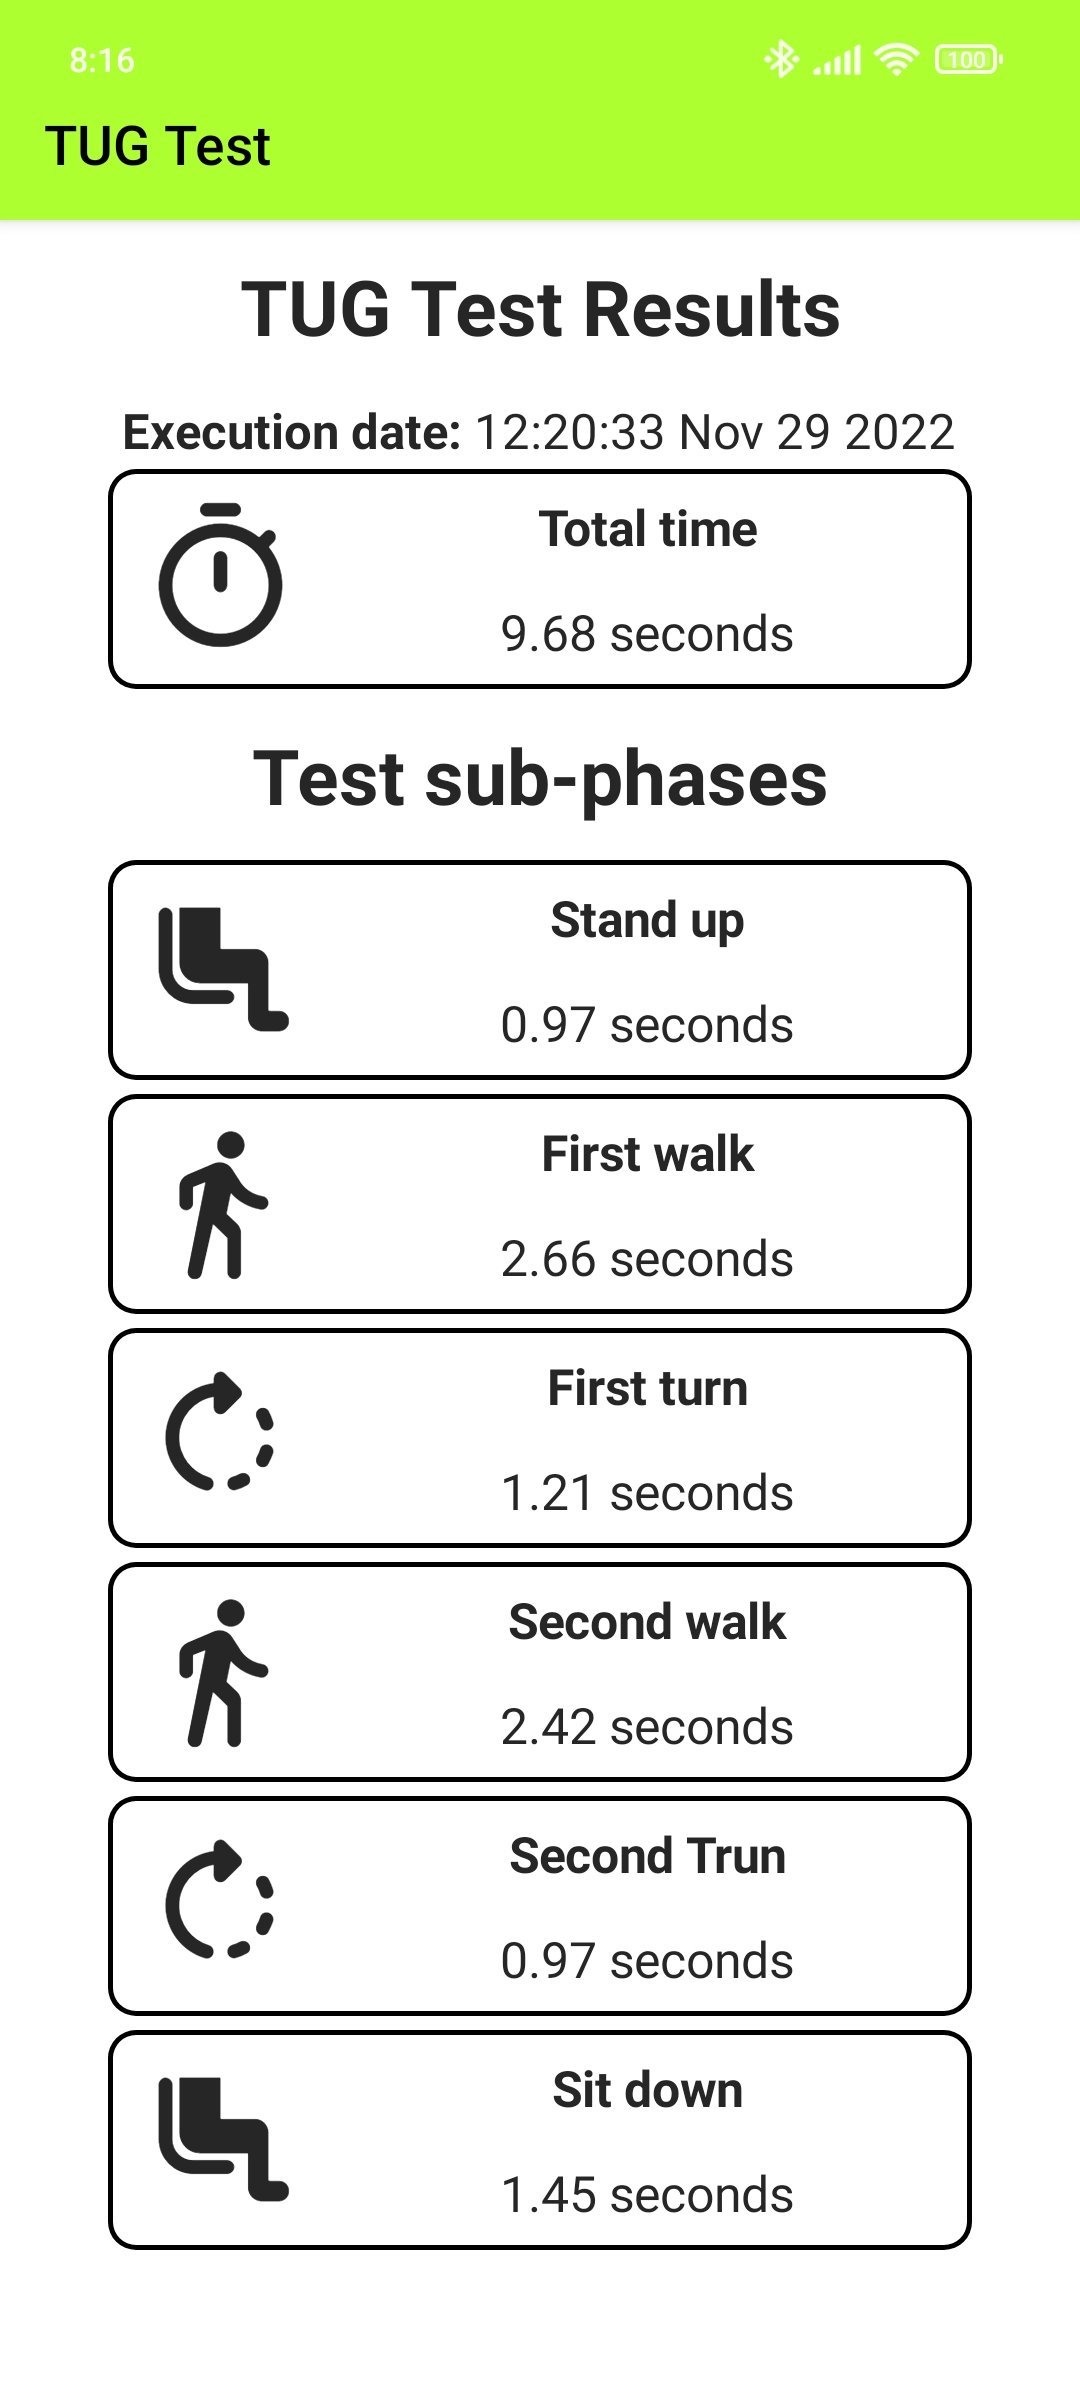
Based on the predicted activities, the system can automatically detect the end of the TUG test and calculate the results. The end is detected when the application predicts three consecutive SEATED activities preceded by some SITTING_DOWN activities. This pattern, which requires the user to maintain a seated position after sitting down, is captured by the system approximately one second after the subject has sat down (i.e., \(3\) consecutive windows of \(50\) samples – \(0.5\) seconds per window – with a \(50\%\) overlap – \(0.25\) seconds –). The application then computes the start and end time (and duration) of each subphase of the test by determining the boundaries between them using the predicted activities. Finally, with the start of the standing_up and the end of the sitting_down subphases, the duration of the entire test is determined. If for some reason the application cannot detect any of the other subphases, it will still be able to compute the total duration of the test as long as these two subphases are correctly identified and their duration calculated.
After the detection of the end of the test, the data collection is automatically stopped on the sensing device (i.e., smartwatch or smartphone), and the test results are calculated and sent to the smartwatch if it is the sensing device. The smartphone application also displays a list of the executed TUG tests and their full results – Figure 4 (a) and Figure 4 (b), respectively –.
The TUG test smartphone application is available in GitHub and Zenodo (Matey-Sanz and González-Pérez 2022a).
This section describes the methodology employed to evaluate the developed system.
Thirty healthy individuals participated in the evaluation of the system. The participants ranged from \(21\) to \(73\) years old (\(\mu = 43.7 \pm 14\)), where the ratio of male/female participants was \(53\%/47\%\).
The experiment was approved by the ethics committee of the Universitat Jaume I (reference No. CD/88/2022) and carried out in accordance with the Declaration of Helsinki.
The objectives and description of the study were explained to the participants, who were informed that they were going to be video-recorded while performing the test, and their written informed consent was obtained. The experiment was approved by the ethics committee of the Universitat Jaume I (reference No. CD/88/2022) and carried out in accordance with the Declaration of Helsinki.
Participants were provided with a TicWatch Pro 3 GPS (WH12018) smartwatch and two Xiaomi Poco X3 Pro (M2102J20SG) smartphones, equipped with an STMicroelectronics LSM6DSO IMU1 sensor. The smartwatch and one smartphone were used as sensing and computing devices respectively (C1), while the other smartphone was used as a sensing and computing device (C2). The participants were instructed to wear the smartwatch on the left wrist (the paired smartphone was left aside) and the smartphone on the left front pocket, without further instructions regarding orientation.
A Xiaomi Poco F2 Pro (M2004J11G) smartphone was also used to video-record the subjects while participating in the study. All devices’ internal clocks were synchronized using the NTP protocol.
Supported by the results presented in the previous section, the CNN architecture has been chosen for activity classification. Therefore, two CNN models (i.e., one for smartphone and other smartwatch data) have been trained for HAR using the dataset presented in Smartphone and smartwatch HAR dataset and embedded in the smartphone application.
Each participant was instructed to execute the TUG test while wearing the smartwatch on the left wrist and the smartphone in the left front pocket, adhering to the following procedure:
Every participant executed the TUG test \(10\) times, yielding a total amount of \(300\) TUG test executions, whose results were extracted from both system configurations. From those \(300\) executions, \(9\) were discarded due to procedural breaches (i.e., start the TUG test before the measuring device is ready).
Then, the recorded videos of the participants were manually analysed to determine the boundaries between the activities contained in the test to measure the duration of the test and its subphases.
In addition, Google’s BatteryHistorian2 tool was used to obtain the percentage of battery consumed by the system in the three devices used in the experiment.
To obtain a first insight into the performance of the TUG automation system, the computed results were classified as follows:
Then, the computed results were compared with the manually obtained results (refernce method) using several metrics:
C1 and C2 with the manual method (i.e., gold standard).Finally, the energy consumption of the system was analysed using the data obtained from the Google’s BatteryHistorian tool.